
Figure 12.
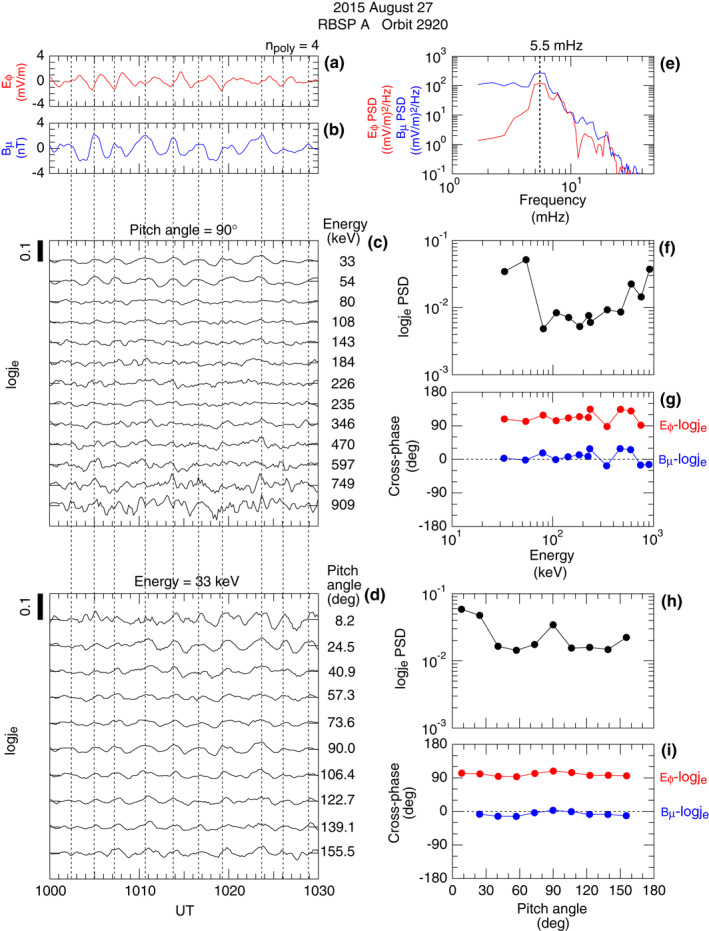
Relationship between symmetric waves and electron flux oscillations observed by RBSP A on orbit 2920. (a) Detrended E ϕ time series. (b) Detrended B μ time series. (c) Detrended logj e time series at 13 energies. The pitch angle is fixed at 90°. The vertical dashed lines mark the peaks seen at 33 keV. (d) Detrended logj e time series at 10 pitch angles. The energy is fixed at 33 keV. (e) Power spectral density (PSD) of the data shown in panels (a) and (b). The vertical dashed line marks the spectral peaks at 5.5 mHz. (f) PSD of the data shown in panel (c), evaluated at 5.5 mHz and plotted as a function of energy. (g) Cross‐phase between E ϕ and logj e (red) and between B μ and logj e (blue). (h) PSD of the data shown in panel (d), plotted as a function of pitch angle. (i) Cross‐phase between E ϕ and logj e (red) and between B μ and logj e (blue).