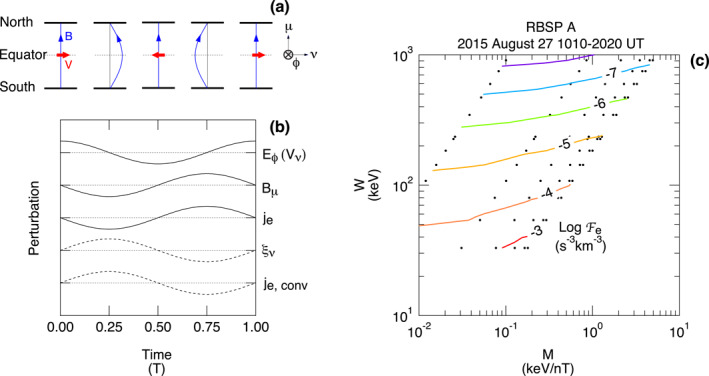
Figure 13.

(a) Radial field line displacement pattern of a symmetric wave plotted a quarter‐wave period apart for one wave period (adopted from Figure 2a of Takahashi et al. [2011]). The red arrows indicate the plasma bulk velocity. (b) Schematic time series plots of the perturbations of observed field components (E ϕ and B μ ) and the electron flux (j e) during the symmetric wave event shown in Figure 12 along with the inferred field line displacement (ξ ν ) and the electron flux perturbation associated with it (j e, conv). The phase of j e, conv reflects the illustrated ξ ν and the observed inward gradient of . (c) derived from the j e measurements made by RBSP A MagEIS at 1010–1020 UT, plotted as a function of M and W. The black dots indicate the data points corresponding to the energies and pitch angles of the measurements.
