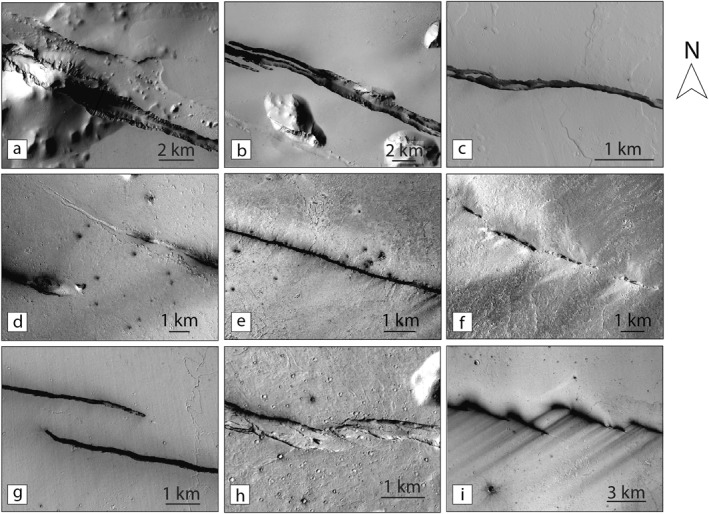
Figure 2.

CTX images of the Cerberus Fossae surface traces, from clear and large fossae along (a and b) G1 and (c) G4 to (d) shallow, (e) narrow, and (f) discontinuous traces along G3, G2, and G5, respectively. (g, h, i) Examples of relay zones between segments at different scales along G4.
