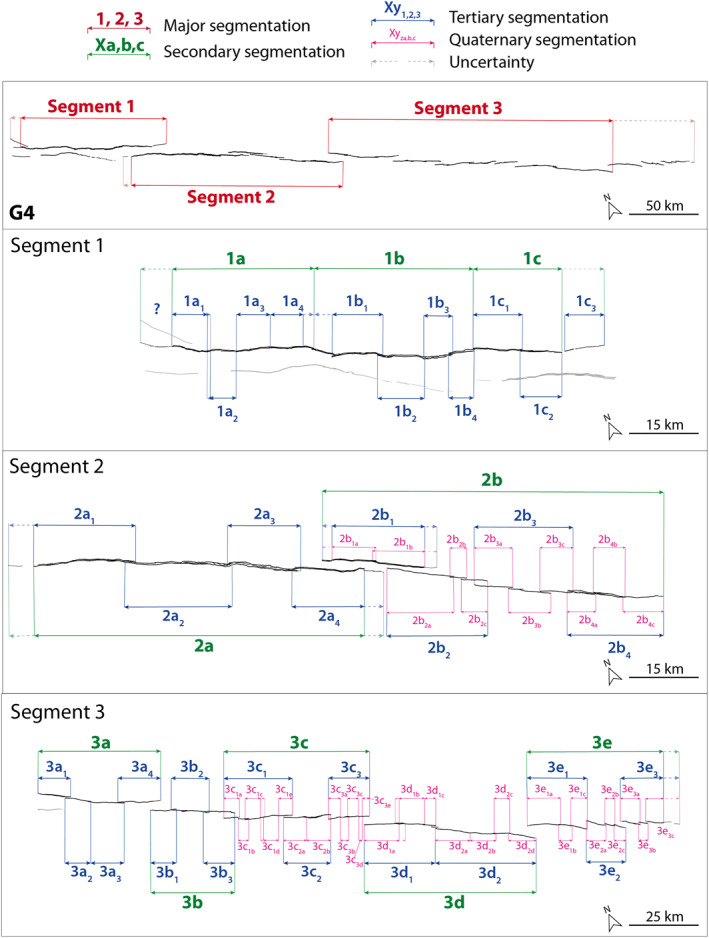
Figure 3.

Representation of the four scales of segmentation analyzed in this study. Black lines are traces of fossa G4 of Cerberus Fossae in map view (see other fossae in Figure S1 in Supporting Information S1). A closer view of the subsegments in each major segment is shown. A detailed description of the segmentation is available in Text S1 in Supporting Information S1.
