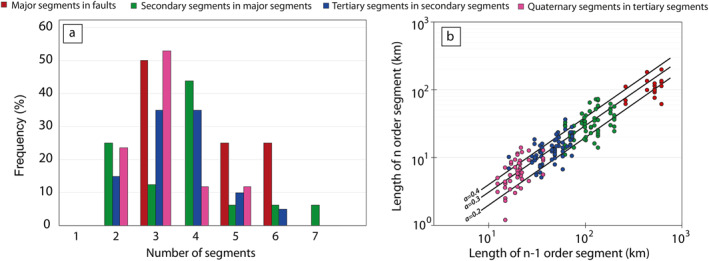
Figure 4.

(a) Frequency distribution of the number of segments/subsegments within faults/segments of the Cerberus Fossae fault system. (b) Relation between the length of each n‐order segment as a function of the length of (n − 1)‐order segment. The black lines are the linear relations LS n = a × LS n−1 where a is a constant of proportionality (a = 0.2, 0.3, and 0.4).
