
Figure 7.
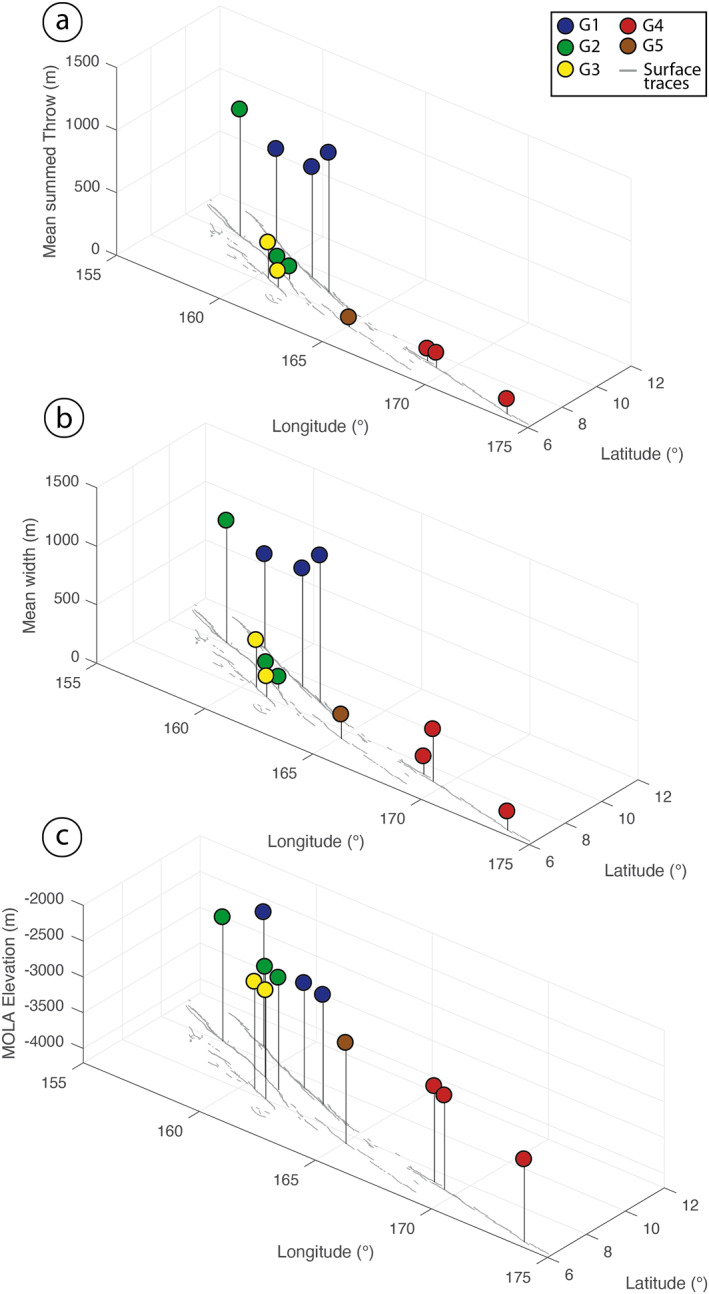
Mean (a) summed throw and (b) width of fossae deduced from each calculated DEM (see Figure 5, Figure S2 in Supporting Information S1), showing the general decrease from west and north (G1 and G2) to east and south (G3, G4, and G5). (c) Corresponding MOLA elevation. Gray lines are surface traces of Cerberus Fossae.