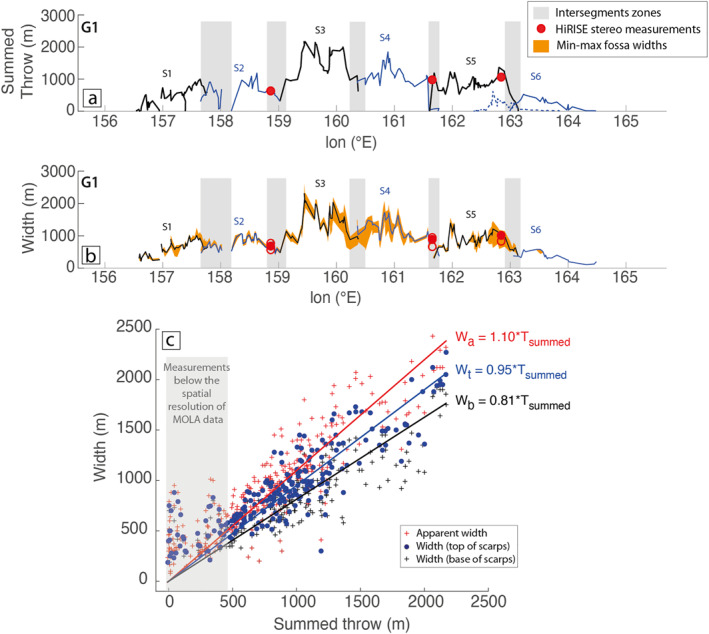
Figure 9.

Along‐strike measurements of throw and width for fossa G1. (a) Summed throw profile (MOLA data; Vetterlein and Roberts, 2010). (b) Corresponding fossa widths (this study, CTX data). Solid lines are preferred fossa widths (Wt; see text and Figure 8), while orange area is determined from maximum (Wa) and minimum (Wb) width measurements (see Figure 8). Solid red dots are preferred width measurements made on DEMs built from High‐Resolution Imaging Science Experiment stereo pairs (Figure 5), while empty red dots are minimum and maximum width measurements. Alternate blue and black profiles represent the major segmentations identified in this study. They are separated by intersegment zones, highlighted by the gray rectangles (major slip trough, see also fault map in Figure S1 in Supporting Information S1); (c) Relations between the summed throw and the width of fossa G1. Blue dots are preferred fossa width values (Wt) and red and black crosses are maximum (Wa) and minimum (Wb) width values, respectively (see text and Figure 8). The three colored lines describe the linear law for each data set and suggest that the fossa Width ∼ Summed Throw (linear correlation coefficient R = 0.94 for the preferred blue law, R = 0.95 for the red law, and R = 0.92 for the black law). Note that the gray‐shaded area highlights the part of the plot where throw measurements are below the spatial resolution of MOLA data (i.e., 463 m/pixel). This explains why width measurements are possibly associated with possibly low underestimated throw measurements (see more details in the text).
