Figure 2.

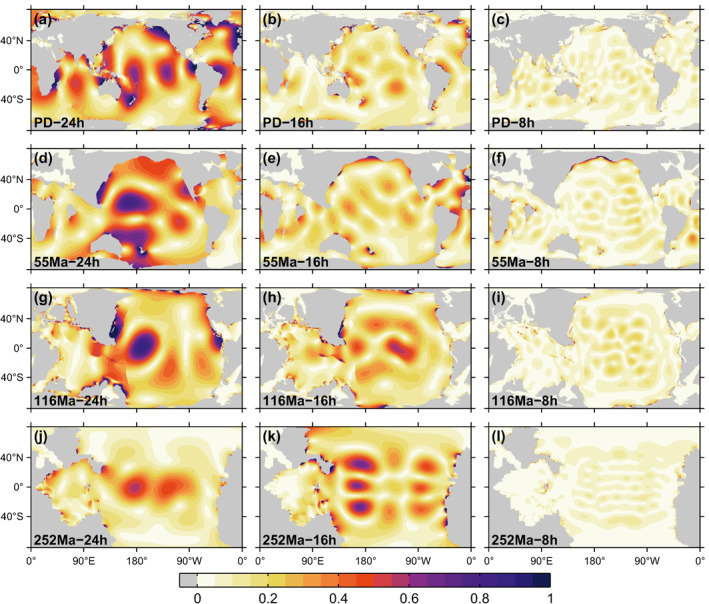
Global maps of amplitude (m) with present‐day (PD), 55 Ma, 116 Ma, and 252 Ma bathymetries (top to bottom rows, respectively), and values (in Equation 6) of 24, 16, and 8 hr (left, middle, and right columns, respectively).

Global maps of amplitude (m) with present‐day (PD), 55 Ma, 116 Ma, and 252 Ma bathymetries (top to bottom rows, respectively), and values (in Equation 6) of 24, 16, and 8 hr (left, middle, and right columns, respectively).