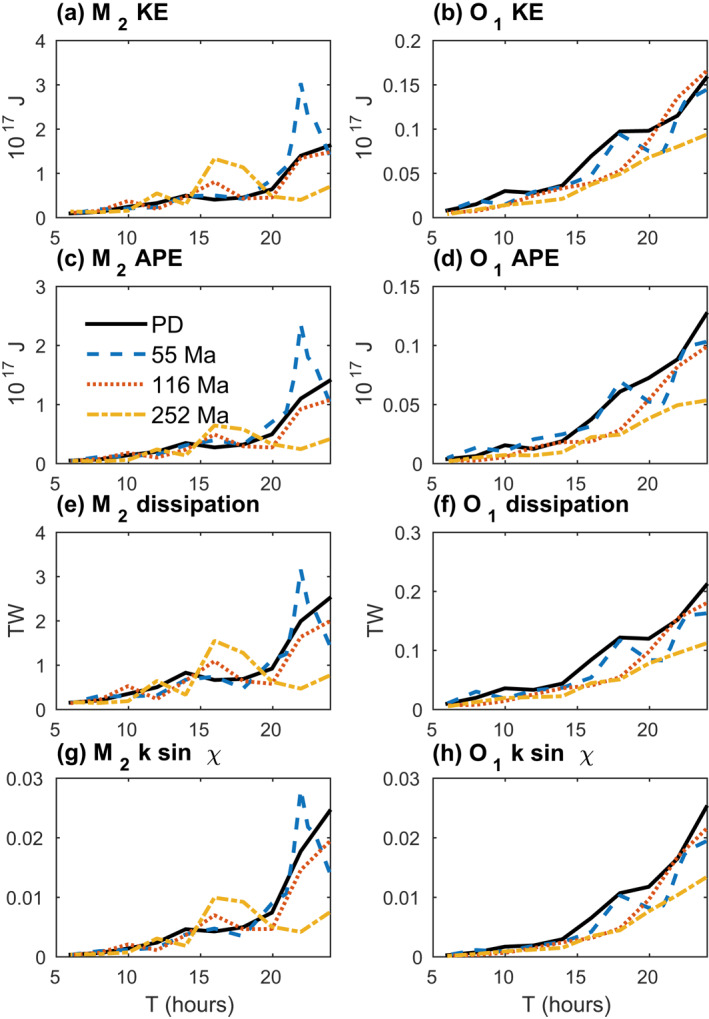
Figure 4.

Globally integrated kinetic energy (; a and b), available potential energy (; c and d), energy dissipation rate (e and f), and values (g and h), for (left‐hand side subplots) and (right‐hand side subplots) ocean tide simulations with different values of in Equation 6, and the four bathymetries shown in Figure 1. Four additional values were used in the 55 Ma simulations, in order to better resolve the peak near 22 hr. Globally integrated and values are computed via Equation 13. This figure, and all subsequent figures, have legends, and the legends are not enclosed by boxes.
