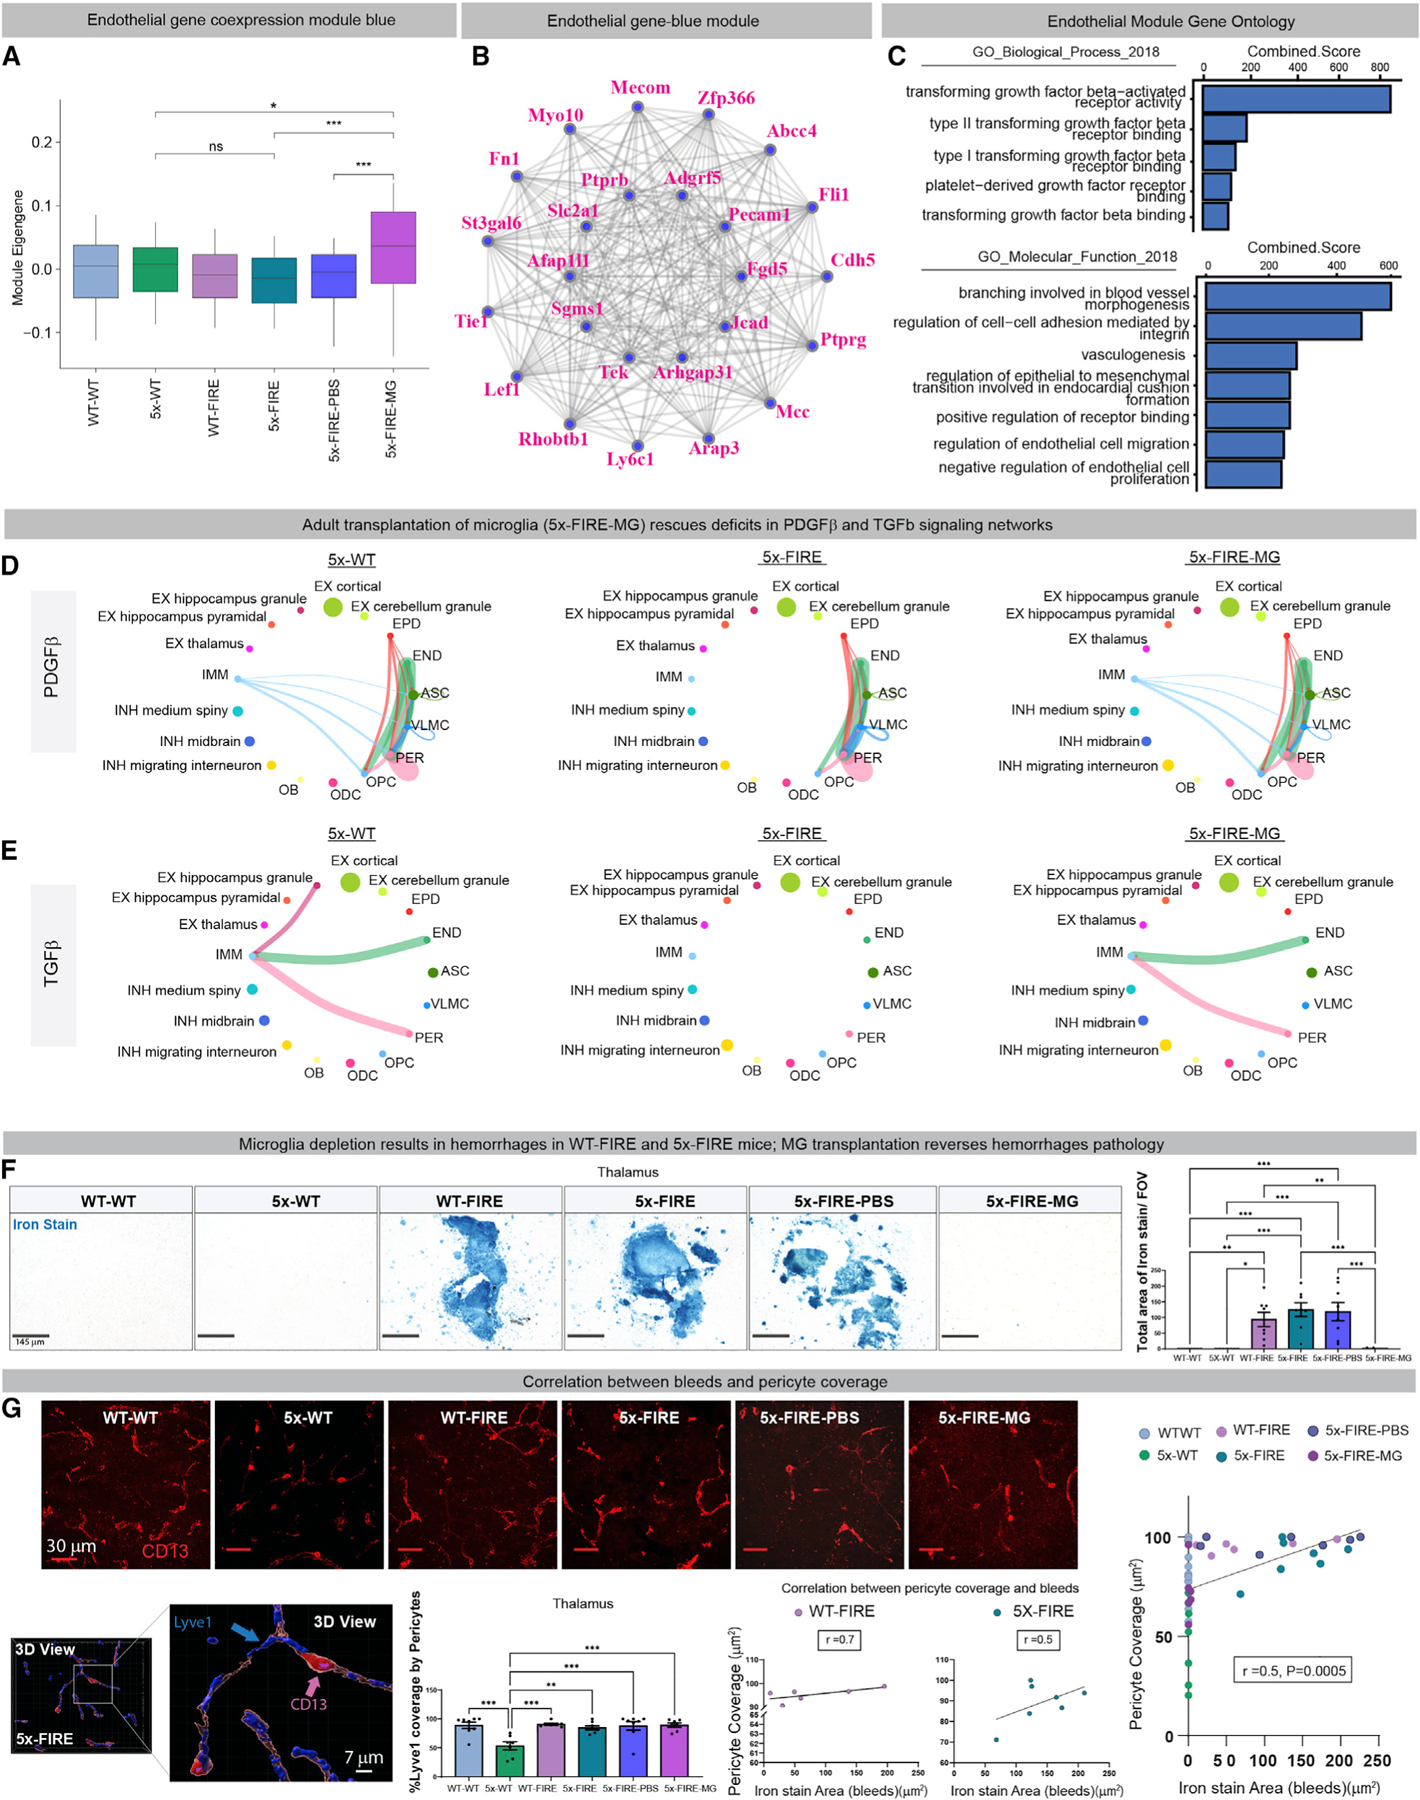
Figure 6. Microglial deficiency induces changes in endothelial gene expression and promotes brain hemorrhages, which can be prevented by adult microglial transplantation.

(A and B) Co-expression network analysis of snRNA-seq data from 5–6-month-old mice (n = 8/group) reveals significant changes in endothelial cell gene expression between 5x-FIRE mice transplanted with microglia versus PBS-injected 5x-FIRE controls, untranslated 5x-FIRE mice, and 5x-WT mice.
(C) Gene ontology analysis further highlights several important pathways that are altered in endothelial cells, including PDGF-β and TGF-β receptor signaling, blood vessel branching, and regulation of endothelial cell proliferation and migration.
(D) CellChat analysis was utilized to identify signaling networks between differing cell types, revealing PDGFβ-related connectivity between the IMM microglia and pericyte clusters that was abolished in 5x-FIRE mice but fully restored with microglial transplantation.
(E) Analysis of TGF-β signaling likewise exhibited a strong connectivity with both pericytes and endothelial cells that was lost in 5x-FIRE mice but restored by transplantation.
(F) Prussian blue iron staining revealed clear evidence of hemorrhages in WT-FIRE, 5x-FIRE, and 5x-FIRE-PBS mice that was completely prevented by adult microglial transplantation.
(G) Given our CellChat identification of pericytes as microglial signaling recipients, pericyte coverage of endothelial cells was examined via CD13 labeling (red) of pericytes adjacent to Lyve1+ blood vessels (blue). This analysis confirmed the previously reported reduction in AD transgenic mice pericytes but revealed no differences between WT-WT and FIRE groups. However, regression analysis comparing pericyte coverage to Prussian blue+ hemorrhages revealed a positive correlation between these measures. Scale bars, 145 µm in F, 30 µm in (G), and 7 µm in the 3D view in (G). Data in (A), (F), and (G) presented as mean ± SEM.*p ≤ 0.05, **p ≤ 0.01, ***p ≤ 0.001.
