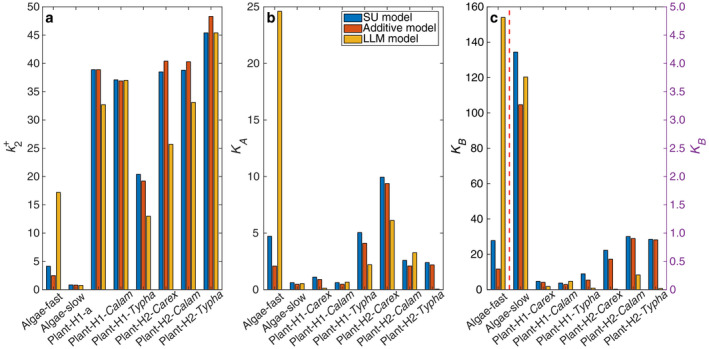
Fig. 5.

Comparison of inferred parameters of the three models for the eight data sets: panel a is for growth rate, panels b and c are for substrate affinity. The parameter values are in Table 1. For panel c, except for fast‐adapted algae (separated by the red dashed line), parameter values follow the right y‐axis. Calam is Calamagrostis abbreviated.
