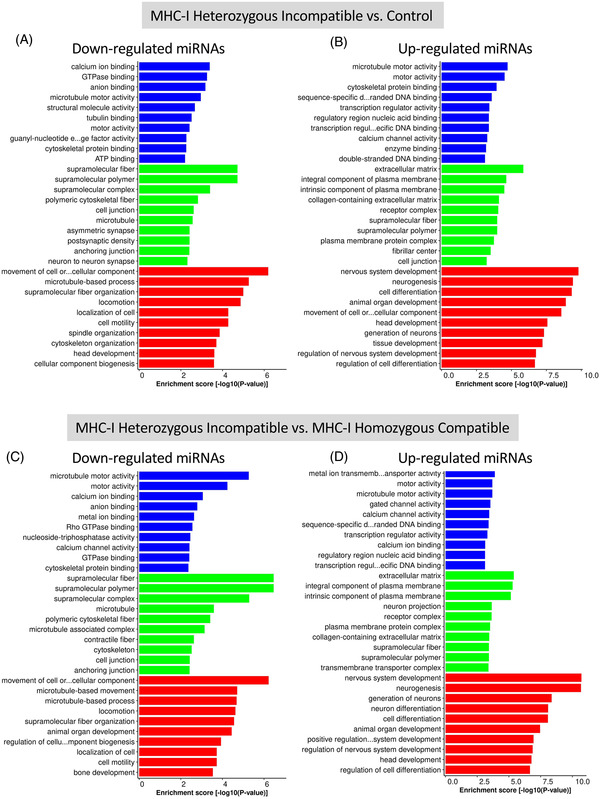
FIGURE 3.

Results of GO analysis of predicted target genes for downregulated miRNAs (A) and upregulated miRNAs (B) between MHC‐I heterozygous incompatible (n = 5) and control trophoblast (n = 8), and predicted target genes for downregulated miRNAs (C) and upregulated miRNAs (D) between MHC‐I heterozygous incompatible (n = 5) and MHC‐I homozygous compatible (n = 9) trophoblast. Blue bars indicate molecular function, green bars indicate cellular components, and red bars indicate biological process. Day 35 ± 1 control pregnancies were established by artificial insemination and MHC‐I heterozygous incompatible and homozygous compatible pregnancies were established by somatic cell nuclear transfer. Enrichment score [−log10(p‐value)] is a measure of how strongly the gene is associated with a specific biological process. GO, Gene Ontology; MHC‐I, major histocompatibility complex class I
