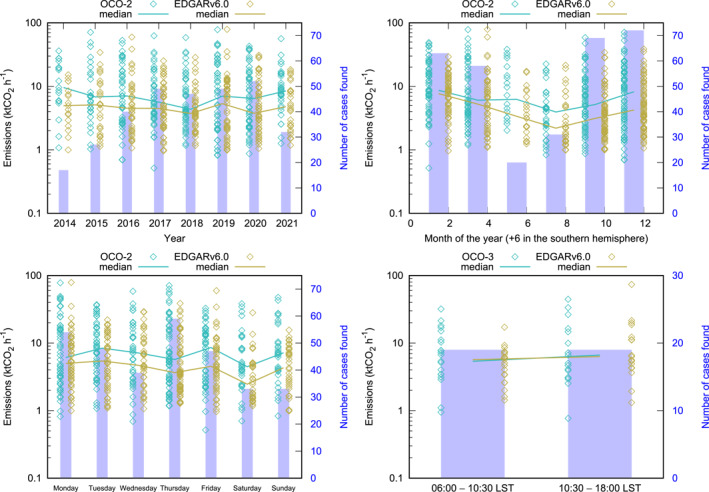
Figure 2.

Retrieved emission values and inventory values as a function of the year, the month of the year (+6 in the southern hemisphere) averaged 2 by 2, the day of the week and the time of the day (of the plume, not of the emissions). In each graph, the number of cases per bin is reported in violet (right axis). The median in each bin is also reported as a curve. Note that the graphs are for OCO‐2, except the one in the bottom right quarter which is for OCO‐3.
