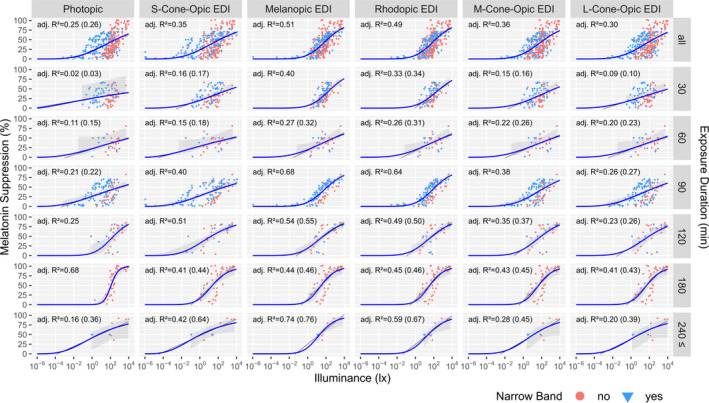
FIGURE 1.

Dose‐response relationship for % melatonin suppression as a function of both photopic illuminance and each of the five α‐opic EDIs for all light exposure durations (top row, N = 326 data points). In the lower rows, the data are split up in bins with different light exposure durations, thus representing % melatonin suppression as determined after 30, 60, 90, 120, 180 and ≥240 min of light exposure. Data points located between the designated bin limits were assigned to the closest bin, as well as all points beyond 240 min were assigned to that bin. The coloured symbols indicate whether the light is narrowband (light blue triangles) or not (red circles). The 95% confidence bands (grey areas) for the logistic fits (blue) were derived using a higher order Taylor expansion and Monte Carlo simulation method, which is only applicable (and shown) for the range of actual data points. Adjusted R 2 values for the logistic fits are provided for each panel. If a linear fit had the same or higher adj. R 2, it is indicated in brackets and the linear fit line is drawn (dark grey)
