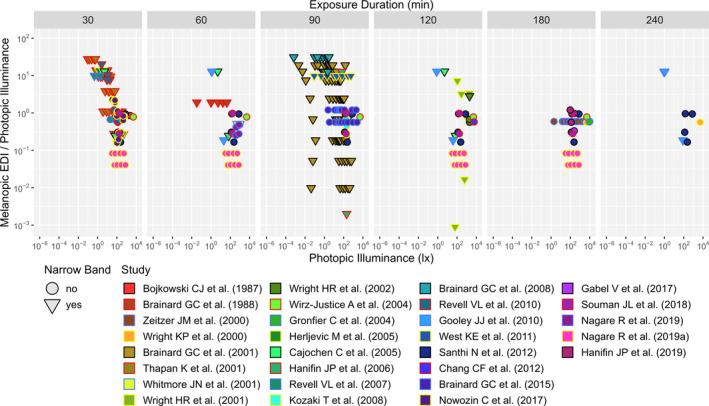
FIGURE 2.

Distribution of photopic illuminance and M/P ratio (ie melanopic DER) for each of the 7 light exposure duration bins. Data points located between the designated bin limits were assigned to the closest bin, as well as all points beyond 240 min were assigned to that bin. Triangles denote narrowband and circles non‐narrowband light conditions. One data point is not displayed due to its position far outside the figure range. It belongs to a narrow band light source in the 90 min bin from the Hanifin et al. 29 study: photopic illuminance = 100.49 and M/P = 10−6.45
