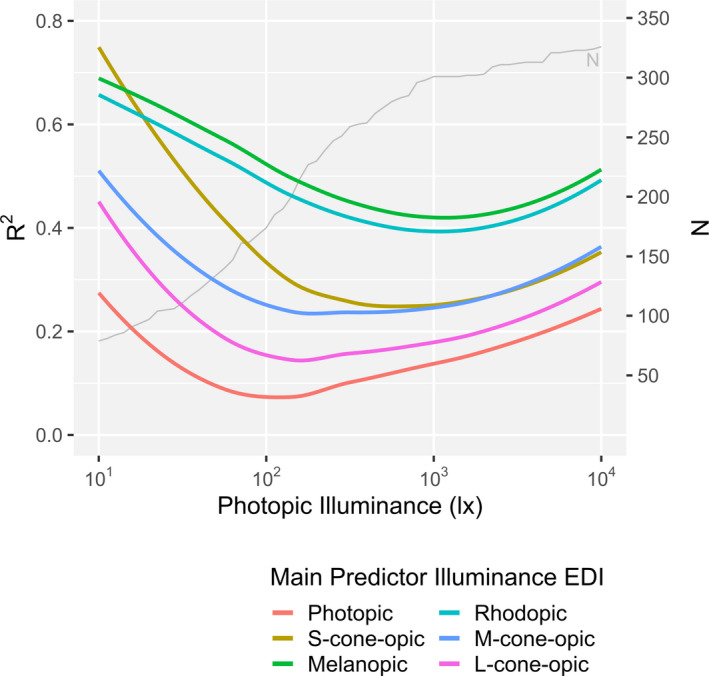
FIGURE 3.

Smoothed R 2 value sequence for single‐predictor logistic dose‐response models (Equation 5) for each α‐opic illuminance. The sequence starts with a data set for which the maximum photopic illuminance is 10 lx (N = 79) and continues including successively more data points with a maximum photopic illuminance that is denoted as cut‐off on the x‐axis, until the whole data set (N = 326, photopic illuminance = 10 000 lx) is included in the model. The lines represent a loess‐fit of the actually calculated values. The S‐cone EDI outperforms melanopic EDI only at photopic illuminances below approximately 21 lux
