
Figure 4.
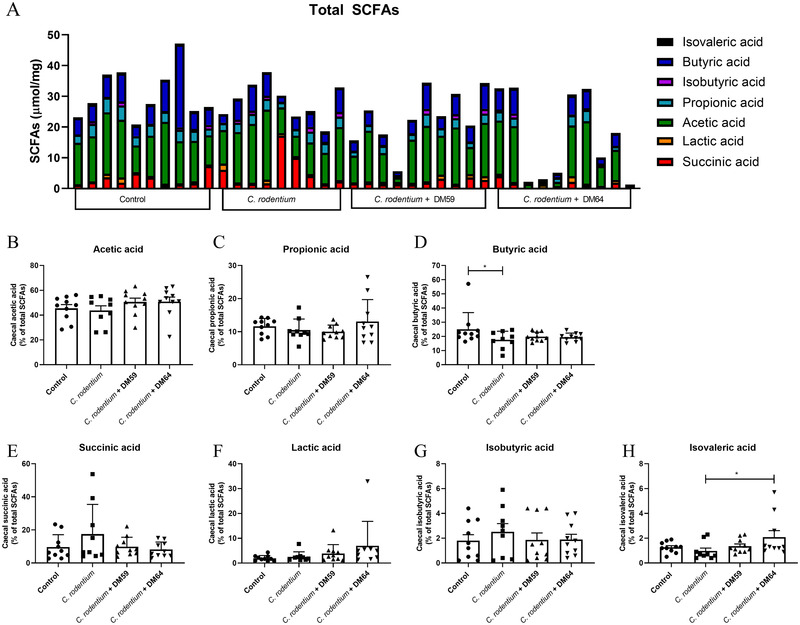
Short chain fatty acids levels in caecum of mice. Total short chain fatty acids (SCFAs) in caecum (µmol mg−1 dry weight of digesta) from control mice, C. rodentium treated mice, C. rodentium + DM59 (low DB) pectin treated mice or C. rodentium + DM64 (high DB) pectin treated mice (A). The relative abundance of acetic acid (B), propionic acid (C), butyric acid (D), succinic acid (E), lactic acid (F), isobutyric acid (G) and isovaleric acid (H) were determined from these total SCFA levels of mice. Statistical differences between experimental groups were determined using one‐way ANOVA, followed by Dunnet post‐test (* p < 0.05, and ** p < 0.01).