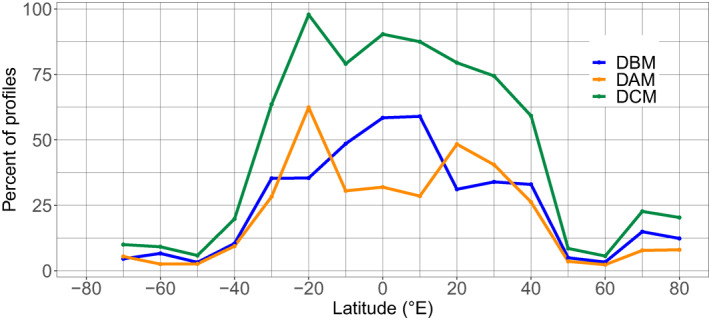
Figure 3.

Mean of monthly percentage of profiles with DCM (green), DBM (blue), and DAM (orange) characteristics as a function of the latitude (per band of 10°). The percentage of DCMs corresponds to the sum of the percentages of DAMs and DBMs. DAM, Deep photoAcclimation Maximum; DBM, Deep Biomass Maximum; DCM, Deep Chlorophyll Maximum.
