Figure 5.

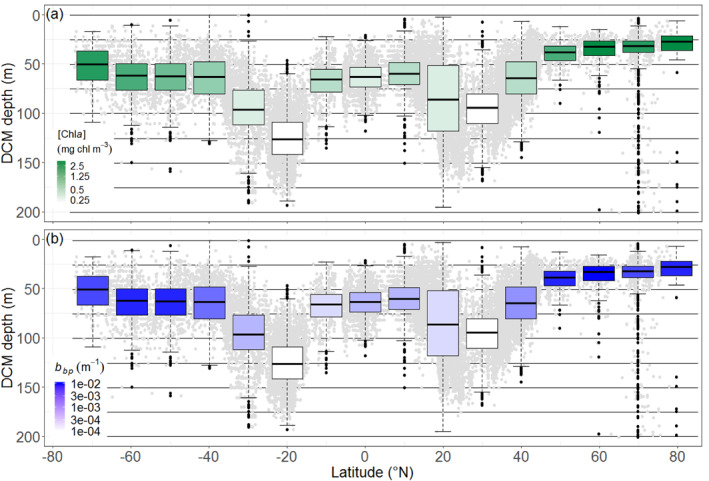
DCM depths (gray dots) and their quartile diagrams per 10° latitude. The mean [Chla] and b bp at the DCM depth are color‐coded with a white‐green log scale (a), and a white‐blue log scale (b). DCM, Deep Chlorophyll Maximum.

DCM depths (gray dots) and their quartile diagrams per 10° latitude. The mean [Chla] and b bp at the DCM depth are color‐coded with a white‐green log scale (a), and a white‐blue log scale (b). DCM, Deep Chlorophyll Maximum.