Figure 6.

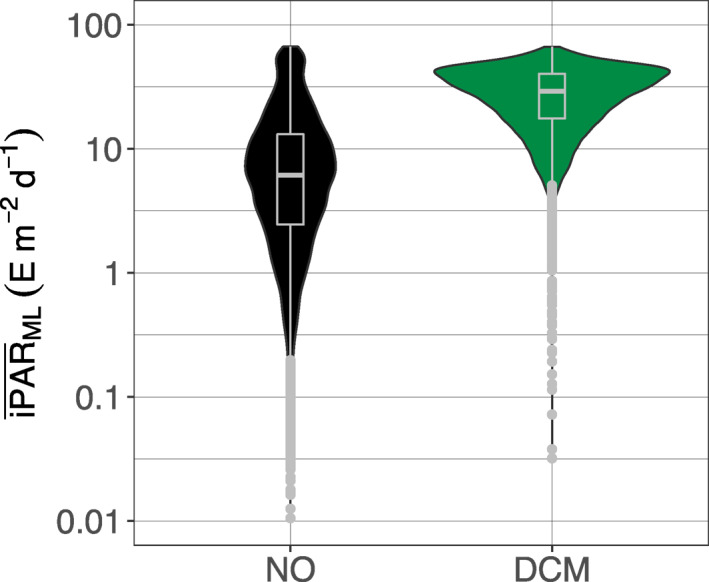
Quartile diagrams and density plots of the mean daily PAR in the mixed layer () for DCM (green) and NO profiles (black). DCM, Deep Chlorophyll Maximum; PAR, Photosynthetically Available Radiation.

Quartile diagrams and density plots of the mean daily PAR in the mixed layer () for DCM (green) and NO profiles (black). DCM, Deep Chlorophyll Maximum; PAR, Photosynthetically Available Radiation.