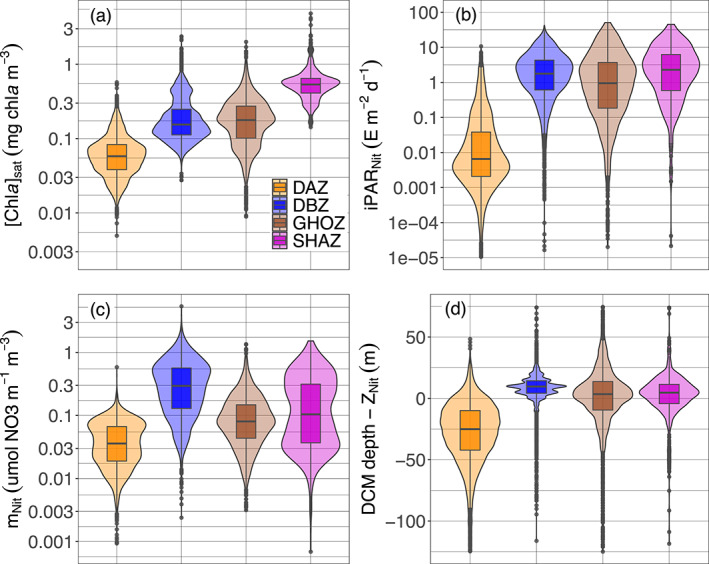
Figure 9.

Quartile diagrams and density plots of the environmental characteristics of DCM profiles according to the four groups (i.e., Shallow Maxima Zone, SHAZ; Ghost Zone, GOHZ; Deep photoAcclimation Zone DAZ; and Deep Biomass Zone, DBZ) from the 28 clustered regions: (a) surface [Chla]sat from satellite observations, (b) iPAR at the nitracline depth (iPARNit), (c) steepness of the nitracline (mNit), and (d) difference between the DCM and the nitracline depths. DCM, Deep Chlorophyll Maximum; PAR, Photosynthetically Available Radiation.
