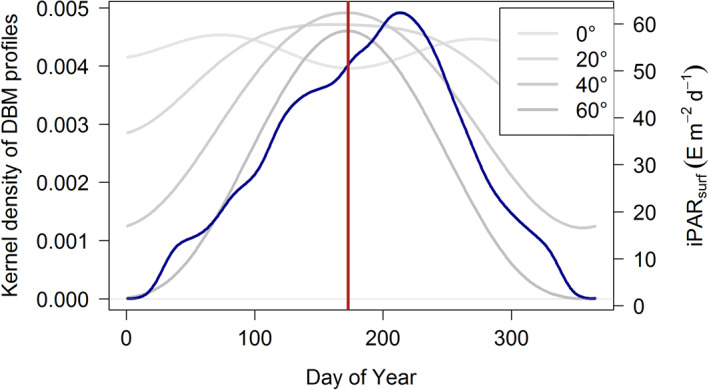
Figure 16.

Density distribution of all DBM profiles as a function of the day of the Northern Hemisphere‐phased year (blue line) with surface iPAR at 0°, 20°, 40° and 60° latitude (gray lines). The vertical red line corresponds to the summer solstice. DBM, Deep Biomass Maximum.
