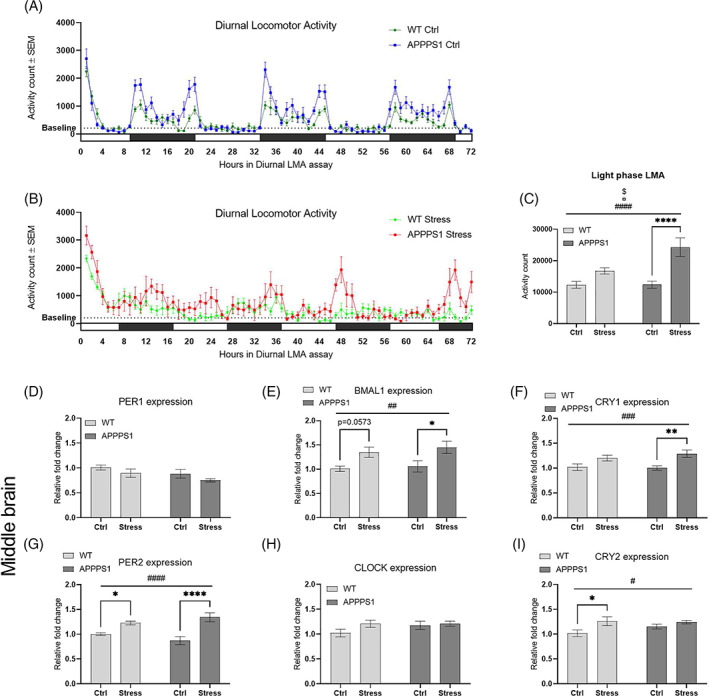
FIGURE 3.

Chronic stress altered diurnal locomotor activity rhythm with abnormal expression of circadian regulatory genes. (A + B) Graphic illustration of the diurnal LMA under control conditions (A) and diurnal disruption conditions (B). Black bars indicate dark periods while white bars indicate light periods. The dotted line indicates a baseline LMA defined by the mean LMA of the WT‐Ctrl in light phase.( C) Light phase activity was significantly affected by stress (p < 0.0001, ####), genotype (p = 0.0195, ¤) and the corresponding interaction effect (p = 0.0209, $). Furthermore, post hoc analysis showed a significant difference between APPPS1‐Ctrl and APPPS1‐Stress (p < 0.0001, ****). Diurnal locomotor activity and light phase locomotor activity (LMA) was performed using n = 13/Ctrl group and n = 8/Stress group. Expression of circadian regulatory genes in middle brain was analyzed and fold change calculated relative to WT‐Ctrl mice. (E) Expression of BMAL1 was significantly affected by stress (p = 0.0014, ##) and post hoc analysis showed a significant difference between APPPS1‐Ctrl and APPPS1‐stress (p = 0.0243, *), and a trend of significant difference between WT‐Ctrl and WT‐Stress (p = 0.0573). (F) Likewise, expression of CRY1 was also significantly affected by stress (p = 0.0006, ###) together with a significant difference between APPPS1‐Ctrl and APPPS1‐Stress (p = 0.0049, **), and a trend of significant difference between WT‐Ctrl and WT‐Stress (p = 0.0885). (G) We observed similar significant main effect of stress on expression of PER2 (p < 0.0001, ####) and significant differences between APPPS1‐Ctrl and APPPS1‐Stress (p < 0.0001, ****) and between WT‐Ctrl and WT‐Stress (p = 0.0425, *). (I) Lastly, the same pattern was observed for expression of CRY2 with a significant main effect of stress (p = 0.0133, #) and a significant difference between WT‐Ctrl and WT‐Stress (p = 0.0212, *). No difference in expression levels were found for PER1 (D) and CLOCK (H) Statistical analyses were performed using two‐way ANOVA with post hoc Bonferroni's multiple comparisons. Expression analyses were performed using n = 9/group for middle brain and n = 10/group for hippocampus
