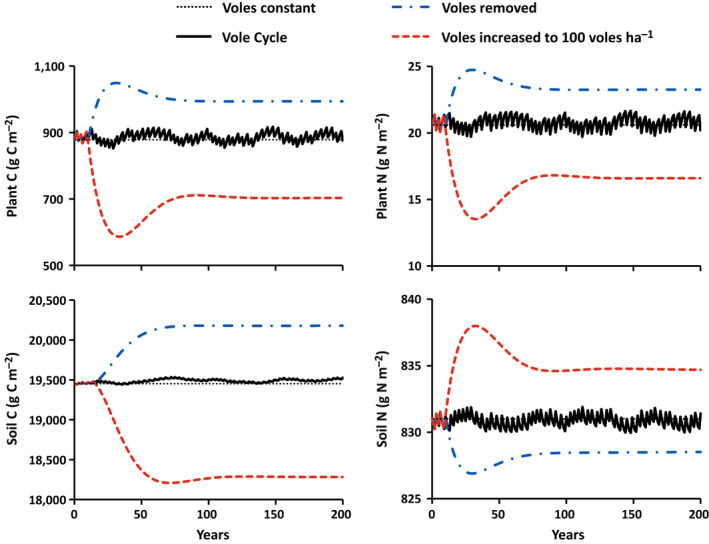
Fig. 2.

Simulated changes in plant and soil organic carbon (C) and nitrogen (N) in response to constant vole abundance, vole cycling, vole density maintained at 100 voles/ha, and vole removal (see Table 4). The thin dotted black lines are the steady‐state values if vole density is held at 40 voles/ha (simulation 1). Solid black lines are the responses to the vole cycle depicted in Fig. 1 (simulation 2). Dashed red lines are the responses to the same vole cycle and then vole density maintained at 100 voles/ha after year 10 (simulation 3). Dashed‐dotted blue lines are the responses to the same vole cycle and then removal of voles after year 10 (simulation 4).
