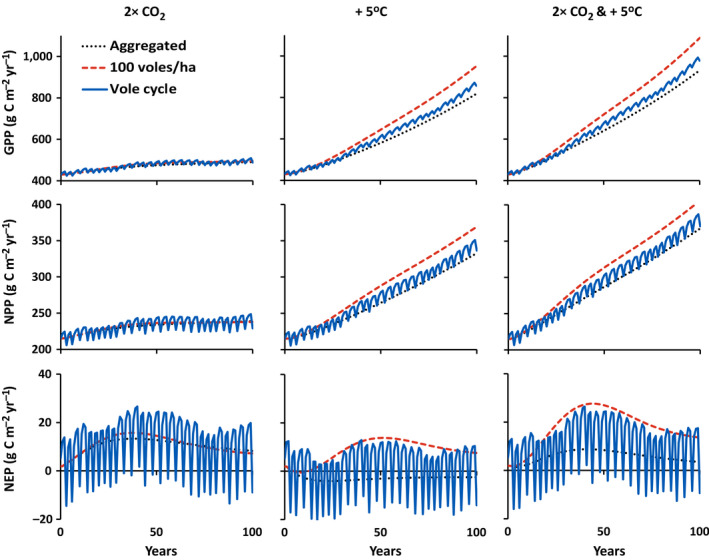
Fig. 6.

Simulated changes in gross primary (GPP), net primary (NPP), and net ecosystem production (NEP) with a linear increase in CO2 from 400 to 800 μmol/mol over 100 years, a linear warming from 10 to 15°C over 100 years, and both a linear increase in CO2 from 400 to 800 μmol/mol and a linear warming from 10 to 15°C over 100 years (see Table 4). Different trajectories indicate responses with vole effects aggregated with other biogeochemical processes (dotted black lines; simulations 5, 6, and 7), voles cycling between 8 and 110 voles/ha on a three‐to‐four‐year cycle (solid blue lines; simulations 8, 9, and 10), and a constant 100 voles/ha (dashed red lines; simulations 11, 12, and 13).
