
FIGURE 3.
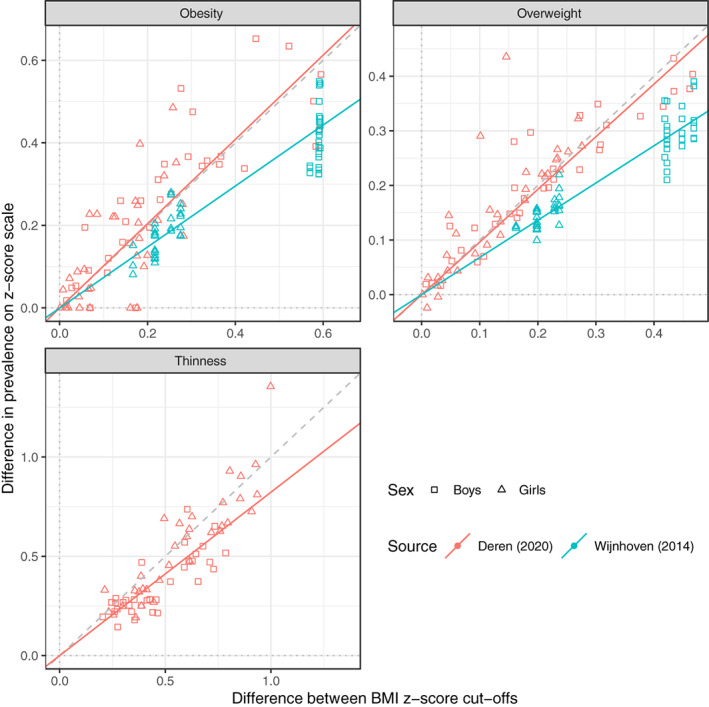
Differences in the prevalence of obesity, overweight and thinness, as measured on the z‐score scale, according to pairs of reference cut‐offs, plotted against the corresponding z‐score difference between the cut‐offs, in 74 groups of boys and girls aged 6.0–17.5 16 , 24 (n = 302). Each point corresponds to a line in Figure 2. The line of equality is shown (dashed), and points are coded by sex and data source, while regression lines per facet are coded by data source. The lines for obesity and overweight with Deren 16 are close to the line of equality, while those for thinness and for Wijnhoven 24 are not