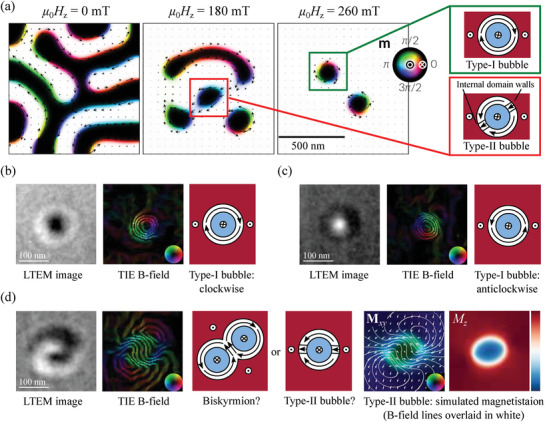
Figure 1.

a) Micromagnetic simulations showing the formation of different types of magnetic bubble as the applied field H z is increased. b–d) Electron microscopy images showing bubbles in MnNiGa together with the projected B‐field reconstructed from a defocus series of such images and the magnetic states to which they correspond with arrows indicating the magnetization direction. Microscopy images like in (d) have been identified as biskyrmions but more likely show type‐II bubbles (see text for details). The images were acquired at room temperature in an out‐of‐plane applied field of 233 mT at defocus Δf = −1.41 mm. The projected B‐field lines correspond to the cosine of 100 times the phase of the exit wavefunction of the electron beam and their direction is indicated by the inset color wheels. The right‐hand panel of (d) labeled M xy shows a micromagnetic simulation of the projected magnetization normal to the electron beam of a type‐II bubble viewed at 9.5° to its axis, indicated by arrows and colors. B‐field lines are overlaid in white and closely resemble the TIE reconstruction. The final panel shows the projected magnetization component parallel to the beam, M z , the strength indicated by the red‐blue color bar with red denoting positive values, blue negative, and white zero.
