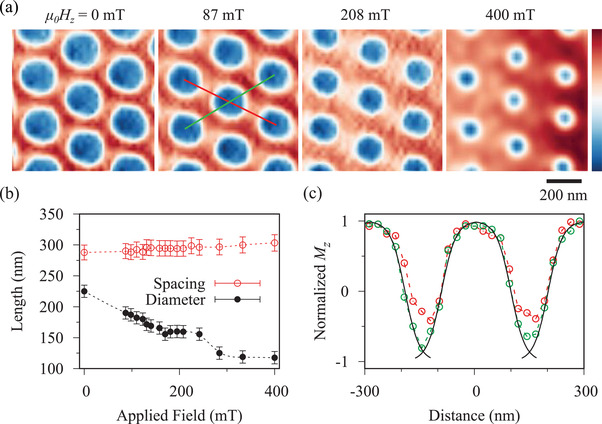
Figure 2.

a) X‐ray holograms showing the component of the magnetization normal to the specimen (M z ) at room temperature as the field applied normal to the specimen plane is increased. The strength of M z is indicated by the color bar with red denoting positive values, blue negative, and white zero. b) The effect of increasing the applied field on the average center‐to‐center spacing of the bubbles and their diameter. c) Linescans taken in the directions shown in (a) by the red and green lines. Solid black lines indicate hyperbolic tangent fits to the magnetic domain walls (see text).
