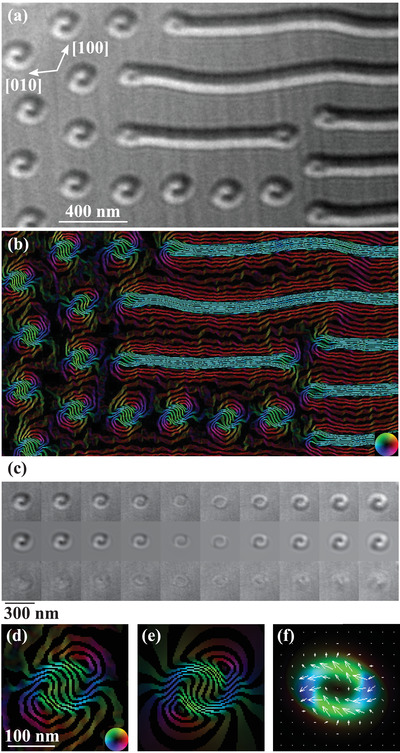
Figure 3.

a) Electron microscopy image showing striped domains and bubbles in MnNiGa at room temperature in an out‐of‐plane applied field of 233 mT with defocus Δf = −1.410 mm. b) Projected B‐field calculated from a defocus series of such images. The color wheel shows the direction of the field and the field lines correspond to the cosine of 100 times the phase of the exit wavefunction of the electron beam. c) Top row: experimental defocus series of one bubble taken at defoci Δf = −1.410, −1.128, −0.846, −0.564, −0.282, 0.282, 0.564, 0.846, 1.128, and 1.410 mm (left to right). Middle row: simulated defocus series. Bottom row: difference between experimental and simulated images. d) Projected B‐field for this bubble calculated from the defocus series and e) from the simulated bubble. f) Simulated projected magnetization from which (e) was calculated.
