Abstract
Multiyear trends in Normalized Difference Vegetation Index (NDVI) have been used as metrics of high latitude ecosystem change based on the assumption that NDVI change is associated with ecological change, generally as changes in green vegetation amount (green leaf area index [LAI] or plant cover). Further, no change in NDVI is often interpreted as no change in these variables. Three canopy reflectance models including linear mixture model, the SAIL (Scattering from Arbitrarily Inclined Leaves) model, and the GeoSail model were used to simulate scenarios representing high latitude landscape NDVI responses to changes in LAI and plant cover. The simulations showed inconsistent NDVI responses. Clear increases in NDVI are generally associated with increases in LAI and plant cover. At higher values of LAI, the change in NDVI per unit change in LAI decreases, with very little change in spruce forest NDVI where crown cover is >50% and at the tundra–taiga ecotone with transitions from shrub tundra to spruce woodland. These lower responses may bias the interpretation of greening/browning trends in boreal forests. Variations in water or snow coverage were shown to produce outsized nonbiological NDVI responses. Inconsistencies in NDVI responses exemplify the need for care in the interpretation of NDVI change as a metric of high latitude ecosystem change, and that landscape characteristics in terms of the type of cover and its characteristics, such as the initial plant cover, must be taken into account in evaluating the significance of any observed NDVI trends.
Keywords: boreal forest, canopy reflectance model, greening, NDVI, tundra
Introduction
Numerous studies have detected vegetation change over time in high latitude ecosystems based on examining trends in Normalized Difference Vegetation Index (NDVI), derived from time series of satellite imagery (Myneni et al. 1997, Goetz et al. 2005, Jia et al. 2009, Bhatt et al. 2017, 2013, Guay et al. 2014, Ju and Masek 2016, Huang et al. 2017, Zhang et al. 2017, Epstein et al. 2019, Wang and Friedl 2019, Jenkins et al 2020). NDVI is defined as
| (1) |
where r Red is reflectance in a red spectral band and r NIR is reflectance in a near infrared spectral band (Tucker 1979). NDVI trends are described as greening when there is a multiyear increasing trend in NDVI, or browning, when there is a multiyear decreasing trend (National Academies 2019, Myers‐Smith et al. 2020). The significance of these NDVI greening or browning trends is related to the inference that NDVI is a metric describing key ecological characteristics. In high latitude ecosystems NDVI has been related to characteristics such as plant cover, green leaf area index (LAI), aboveground biomass, and vegetation productivity (Steltzer and Welker 2006, Riedel et al. 2005a , Huemmrich et al. 2010a, 2010b, Pattison et al. 2015, Walker et al. 2003, Epstei et al. 2012, Raynolds et al. 2012, Rocha et al. 2012, Kobayashi et al. 2018, Walther et al. 2018). High latitudes are experiencing rapid climate change and the observed widespread NDVI changes are presumed to indicate ecosystem responses to climate (Myneni et al. 1997, Jia et al. 2009, Bhatt et al. 2017, 2013). However, due to the complexity in spatial heterogeneity of Arctic landscapes of tundra and boreal forest biomes and the ecotone between them there remains the question of why different regions experiencing similar levels of climate change exhibit different NDVI responses (National Academies 2019, Myers‐Smith et al. 2020). The specific drivers of satellite NDVI trends in high latitude ecosystems have yet to be clearly identified (Beamish et al. 2020).
To understand the significance of the observed NDVI trends in high latitudes (greening, browning, or no change) requires a clear description of the nature of the responses of NDVI to ecosystem change across the landscape (Walker et al. 2012). Fundamental remote sensing theory posits spectral reflectance can be related to chemical or physical characteristics of the landscape (Hope and Stow 1996, Laidler and Treitz 2003). One reason spectral reflectance indices, such as NDVI, were developed was to enhance the signal from some types of spectral characteristics related to variables of interest, for example green LAI, while minimizing sensitivity to reflectance changes associated with varying brightness in scenes (Rouse et al. 1973). In red–near‐IR reflectance space, the NDVI of a given point is a measure of the slope of a line from that point to the origin (where the origin is 0 red and 0 near IR reflectance). The actual slope of that line is the Simple Ratio (SR) Index (SR = near IR reflectance/red reflectance) and NDVI has a nonlinear relationship with SR. Points that fall along a single line radiating from the origin in red–near‐IR space all have the same NDVI value. Fig. 1 illustrates this by showing lines of equal NDVI radiating from the origin.
Fig. 1.
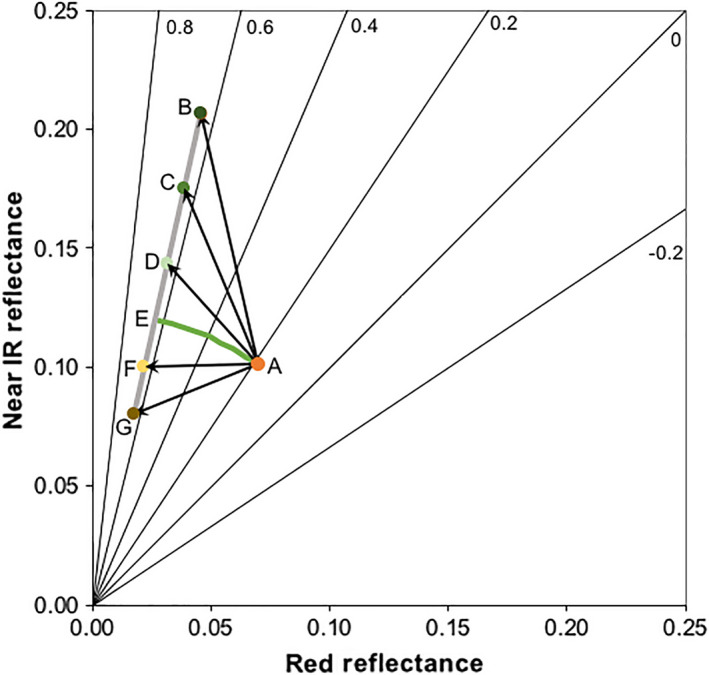
Red and near IR reflectance space, where lines of constant normalized difference vegetation index (NDVI) are straight black lines radiating from the origin with the NDVI values shown by each line. The black arrows show transitions from an initial reflectance, at point A, to the reflectances under different conditions indicated by points B, C, D, F, or G. The reflectance changes can be partitioned into two components, the change that results in a change in NDVI shown by the green arc AE and the reflectance change that has no effect on NDVI shown as the gray line that radiates from the origin. Even though the reflectance change from A to any of the other points B, C, D, F, or G are different in both magnitude and direction, they all result in the same change in NDVI.
When considering how landscape reflectance change in the red–near‐IR reflectance space is transformed into change in NDVI, the reflectance change can be decomposed into two components. The component of the reflectance change in the direction of the origin has no effect on NDVI, while the component along arcs centered on the origin drives the NDVI change. As an example, in Fig. 1, the change in reflectance from point A to point B results in a change in NDVI that is described as the component of the change that follows the arc from A to E, while the component of change from E to B has no effect on NDVI. The NDVI of points B, C, D, E, F, and G all have the same value, and so a reflectance change from point A to any of those other points all have the same NDVI change, even though the magnitudes and directions of the reflectance changes are different. Further, a reflectance change between points nearer the origin results in larger changes in NDVI than from an equal reflectance change for points far from the origin due to the convergence of the lines of equal NDVI at the origin. Thus, the NDVI response to different types of spectral change may vary widely not only due to the magnitude of the reflectance change but also on the direction of that change and the location of the reflectance values in red–near‐IR reflectance space.
To begin to understand the significance of NDVI change in high latitude landscapes requires a sense of the types of reflectance changes associated with ecological changes in different types of landscapes. We wish to explore how rates of NDVI change in terms of greening, browning, or no change are related to change in ecosystem characteristics. To address this in this study, canopy reflectance models are used to simulate a representative set of scenarios of types of potential landscape changes expected to occur in high latitude regions to illustrate red and near IR reflectance and NDVI responses. Modeling is a useful approach for this type of analysis as it provides clear and controlled physically based descriptions of landscape reflectance trends that avoid the noise, variability, and uncertainties inherent in measured data. In these scenarios basic landscape types are described and characteristics (e.g., plant cover or LAI) are altered in ways that represent possible ecological change that may be potential sources of NDVI trend signals. These simulated changes can represent spatial variability such as change along a temperature or moisture gradient, or temporal change such as multiyear increases or decreases in summertime plant growth related to warming or water availability that may result in observable NDVI trends. The scenarios represented types of tundra, boreal forest, and transition landscapes and the simulations will be used to illustrate the varying sensitivity of NDVI to different types of landscape changes in high latitude ecosystems.
Materials and Methods
Three canopy reflectance models were used to simulate red and near IR reflectance for the scenarios in this study; linear mixture model, the SAIL (Scattering from Arbitrarily Inclined Leaves) model, and the GeoSail model. Each of these models described different landscape types. Linear mixture models simulated the reflectance of mosaics of non‐overlapping components occurring within a single pixel (Garcia‐Haro et al. 1996). The SAIL model is a turbid media radiative transfer model that describes the leaves and other components in the canopy as a cloud of infinitesimal particles. In this study, it was used to describe reflectance of canopies of graminoids and shrubs with varying LAIs (Verhoef 1984). Finally, the GeoSail model is a hybrid geometric‐radiative transfer model that described reflectance of vegetation that grow in clumps and cast shadows, such as shrubs and spruce trees (Huemmrich 2001). All three of these models have been successfully applied to high latitude landscape simulations (Garcia‐Haro et al. 1996, Hall et al. 1997, Olthof and Pouliot 2010, Zhang et al. 2020).
All of the simulations described top‐of‐canopy nadir‐viewed reflectance at a constant solar zenith angle of 60.76°, which was the solar angle for an 11:00 overpass at 70° N near peak growing season in mid‐August. These observation variables were held constant to focus on effects of landscape changes while avoiding effects of varying atmosphere, view, and illumination geometries on reflectance.
Input data for the mixture modeling were derived from in situ field spectral reflectance measurements collected in the Barrow Environmental Observatory (Huemmrich 2013). While, for clarity, only single values of moss and lichen reflectances were used in this study, they have been shown to have widely variable reflectances (Vogelmann and Moss 1993, Kuusinen et al. 2020). For example, the data used in Gamon et al. (2013) had variations in lichen NDVI between 0.17 and 0.71 and moss between 0.36 and 0.90 within a limited area of tundra. Further, the NDVI of these non‐vascular plants can vary with water content (May et al. 2018).
Leaf and twig spectral reflectance and transmittance data for graminoids, spruce, and shrubs for the SAIL and GeoSail models were measured using an integrating sphere from samples collected in the boreal forest in the BOREAS (BOReal Ecosystem Atmosphere Study) experiment (Hall et al. 1997).
All spectra were convolved to simulate MODIS bands 1 and 2, red and near IR bands respectively, for the NDVI calculations (Table 1).
Table 1.
Optical properties in MODIS bands 1 and 2, red, and near IR bands, respectively, used as model inputs, where Rfl refers to reflectance and Trn is transmittance.
| Type | Band 1 | Band 2 |
|---|---|---|
| Bare soil | 0.048 | 0.101 |
| Snow | 0.887 | 0.700 |
| Sphagnum (Sphagnum spp.) | 0.071 | 0.299 |
| Lichen (Cladina rangiferina) | 0.169 | 0.395 |
| Standing water | 0.010 | 0.004 |
| Green graminoid Rfl | 0.101 | 0.450 |
| Green graminoid Trn | 0.064 | 0.496 |
| Dead graminoid Rfl | 0.249 | 0.418 |
| Dead graminoid Trn | 0.072 | 0.168 |
| Alder leaf Rfl | 0.079 | 0.515 |
| Alder leaf Trn | 0.013 | 0.401 |
| Alder twig Rfl | 0.096 | 0.598 |
| Spruce needle Rfl | 0.100 | 0.479 |
| Spruce needle Trn | 0.026 | 0.390 |
| Spruce bark Rfl | 0.038 | 0.107 |
A series of scenarios were established to describe different examples of high latitude landscapes in the models. Landscape characteristics were varied to examine resulting reflectance and NDVI responses. Polar desert landscape scenarios were described using linear mixture models with varying coverage of different pairs of cover types including bare soil, open water, moss, lichen, and graminoid canopies. Graminoid canopy scenarios were simulated using the SAIL model to describe variations in green and standing dead LAI and effects of different types of background under the graminoids, such as bare soil, water, or moss. Shrub tundra landscape and spruce woodland scenarios were simulated using the GeoSail model to look at the effects of varying shrub and tree coverage. These simulations are summarized in Table 2.
Table 2.
Summary of the different scenarios presented in this study.
| Simulated landscape type | Model used | Description of simulations | Figures |
|---|---|---|---|
| Polar desert | Mixture model | variable mixtures of bare soil with lichens, mosses, vascular plants, snow, and water; and mixtures of water and vascular plants | Figs. 2, 3 |
| Graminoid tundra | SAIL model | graminoid canopies varying total LAI with backgrounds of bare soil, lichens, mosses, and water | Figs. 4, 5 |
| Graminoid tundra | SAIL model | graminoid canopies varying total LAI with bare soil background and varying fractions of standing dead plants | Figs. 4, 6 |
| Shrub tundra | GeoSAIL model | varying shrub cover on a background field of moss or graminoids; shrub crown LAI also varied | Figs. 9, 7 |
| Spruce woodland | GeoSAIL model | varying spruce cover on a background field of shrubs or lichens; shrub crown LAI varied and spruce crown LAI varied | Figs. 9, 8 |
Results
Polar desert linear mixture model simulations
In these simulations, polar desert tundra landscapes were described as simple mixtures of different basic cover types with no overlap. Linear mixture methods were used to simulate mixtures of pairs of different landscape cover types where the sum of the percent covers of the two types always equals 100% (Fig. 2). The end member reflectances were based on measured values (Table 1) except for the vascular plant (VP) end member which was a SAIL model simulation of a canopy consisting of graminoids with a green LAI of 0.75 and standing dead LAI of 0.25 over a bare ground background (see Graminoid tundra sail model simulations).
Fig. 2.
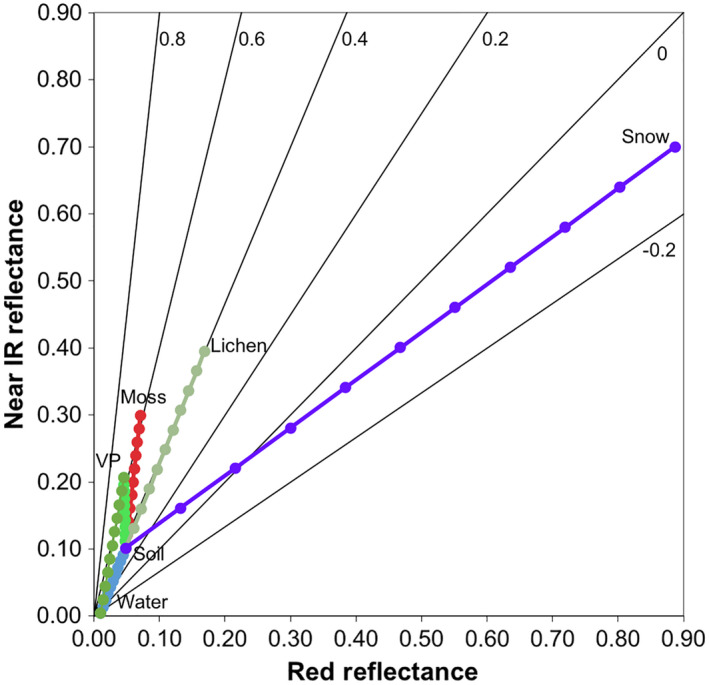
Red and near IR reflectances of tundra landscape components with colored lines showing reflectances calculated from the linear mixture model of mixtures of bare soil and the other components where the combination of the two components totals 100%. The component end members are listed in Table 1 and labeled in the plot. VP stands for vascular plants (canopy consisting of graminoids with a green leaf area index [LAI] of 0.75 and standing dead LAI of 0.25). The line colors correspond to the lines in Fig. 3 (see Fig. 3 legend), and points along these lines represent 10% increments of the mixtures. Lines of constant NDVI are black lines radiating from the origin with the NDVI values shown by each line.
The modeled reflectances of simple pairwise mixtures of each of the different cover types and bare soil are shown in Fig. 2. The end members are separable in red–near‐IR space, resulting in different lines for reflectances of the different mixtures.
In the polar desert linear mixture model simulations, increases in moss or VP cover from bare soil increases NDVI. These mixtures have different lines through red–near‐IR space (Fig. 2), while the NDVI responses to varying cover fractions are almost indistinguishable (Fig. 3). Increasing lichen cover has little effect on NDVI, yet it can represent a large change in reflectance, because the reflectance change occurs close to a line of equal NDVI in red–near‐IR reflectance space (Fig. 2). Increasing standing water coverage decreases NDVI, particularly in cases where water coverage represents a large fraction of the landscape. Small differences in reflectance values near the origin may result in large NDVI changes, as illustrated by a change in NDVI of 0.42 as standing water cover changes from 90% to 100% in a mixture with bare soil and a change in NDVI of 0.71 for a similar change in VP (Fig. 3). Further, beyond a 30% VP cover, the mixtures of open water and VP have a higher NDVI than the bare‐soil–VP mixtures.
Fig. 3.
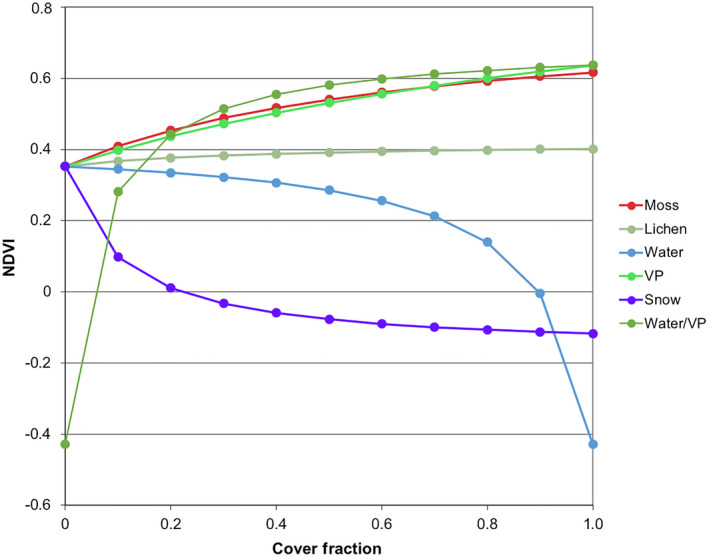
NDVI, calculated from reflectances shown in Fig. 2, from the linear mixture models of bare soil with other landscape cover types. The line colors correspond to the lines in Fig. 2. For all lines except one, the x‐axis value is the cover fraction of the cover type given in the legend, with the 0 cover fraction value representing 100% bare soil cover. VP stands for vascular plants (canopy consisting of graminoids with a green LAI of 0.75 and standing dead LAI of 0.25). The line labeled Water/VP describes mixtures of open water and VP cover, so for this line the 0 cover fraction value on the x‐axis represents 100% open water and the x‐axis values represent vascular plant cover fractions.
Small amounts of snow in the scene can significantly reduce NDVI. Snow is very bright with large red and near IR reflectances resulting in a large reflectance difference from bare soil. The reflectance changes from mixtures of snow and bare soil have the greatest effect on NDVI for low values of snow cover fraction where the mixture reflectances are closer to the origin. The change from 100% bare soil to 10% snow cover results in a decrease in NDVI of 0.25. The strong effect of even small amounts of snow cover may be a source of year to year variability in NDVI time series for high latitude sites where late snowfalls in the spring or early snowfalls in the autumn may affect seasonal NDVI patterns and snow cover lingering into summer can even affect seasonal maximum NDVI if it coincides with the time of measurement.
1. Graminoid tundra SAIL model simulations
South of the polar desert tundra landscapes are almost completely covered by vegetation, frequently these vegetated areas are dominated by graminoids, such as cotton grass (Eriophorum vaginatum) and tundra grass (Dupontia fischeri). These types of canopies were simulated using the SAIL model. The simulated canopy consists of mixtures of live and standing dead leaves with spherical leaf angle distributions over a background comprised of either bare soil, lichens, sphagnum moss, or standing water (Table 1). Each set of model runs consists of simulations with total canopy LAI (green plus standing dead) of 0.01, 0.25, 0.50, 0.75, 1.00, 1.50, 2.00, 3.00, 4.00, and 5.00, which cover the range of expected LAI for graminoid tundra (Riedel et al. 2005b , Spadavecchia et al. 2008).
The first set of simulations examines the effects of different backgrounds for canopies consisting of 75% green and 25% standing dead leaves (Figs. 4 and 5). The VP end member in the polar desert mixture model simulations discussed in Polar desert linear mixture model simulations section was the calculation for a total LAI of 1 with bare soil background from these SAIL simulations.
Fig. 4.
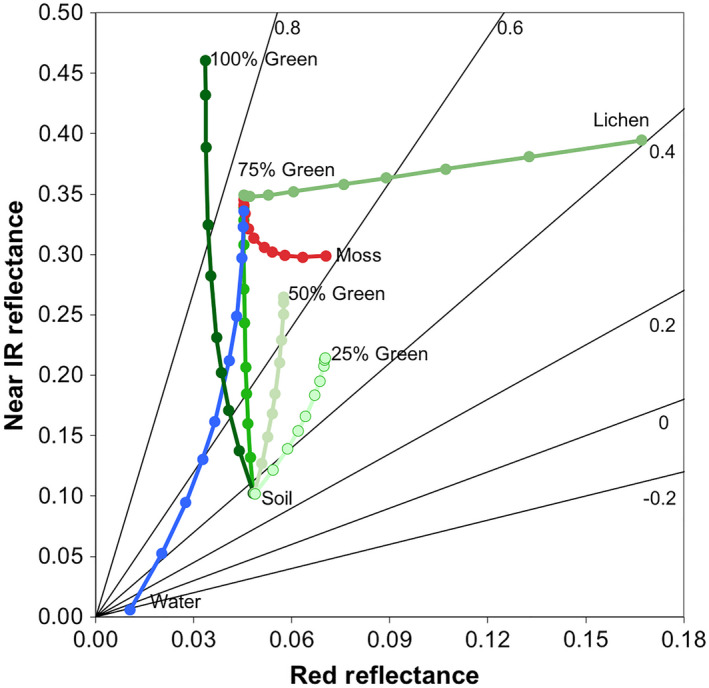
Red and near IR reflectances calculated using the SAIL canopy reflectance model. Points labeled water, soil, moss, and lichen indicate the reflectance of canopy backgrounds used in the simulations. The colored lines from the background points indicate the change in reflectance with increasing total canopy LAI, i.e., the sum of standing dead and green leaves, and these lines are labeled indicating the fraction of green leaves in the canopies. The line colors correspond to the lines in Figs. 5 and 6. Black solid lines radiating from the origin are lines of constant NDVI with the NDVI values shown by each line.
Fig. 5.
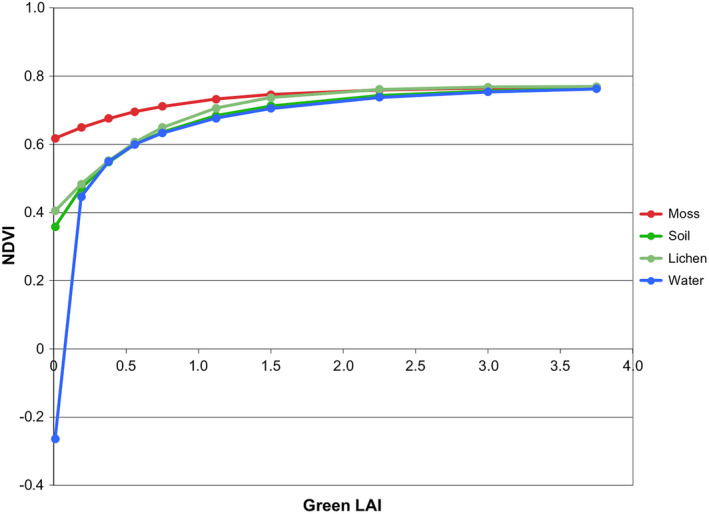
Effects of different backgrounds on NDVI from SAIL model simulations of graminoid canopies consisting of 75% green leaves and 25% standing dead leaves calculated from the reflectances shown in Fig. 4. The line colors correspond to the lines in Fig. 4.
The change in NDVI with increasing LAI is nonlinear, so that an equal increase in green LAI starting from low LAI values will result in a larger NDVI response than the same increase in LAI starting from higher LAI values (Fig. 4). For example, an increase in 0.5 total LAI for the bare ground background case starting from 0 LAI increases NDVI by 0.19, while starting from LAI of 1.5 the same LAI increase results in an NDVI increase of only 0.03.
Once again, the background reflectances in these scenarios are widely separated in red‐near IR reflectance space (Fig. 4), however the bare ground and lichen end members have very similar NDVIs (Fig. 5). The moss background has a relatively high NDVI, which is greater than the NDVI for a graminoid canopy with a soil background and a green LAI of 0.75. This results in less sensitivity in NDVI to increasing canopy LAI with moss backgrounds.
Standing water has a very low NDVI and low red and near IR reflectances, so the effect of even small amounts of green LAI growing out of the water is a dramatic increase in NDVI, with an increase of 0.71 NDVI when total LAI increases from 0 to 0.25. However, further increases in LAI over a water background show little difference from the bare ground or lichen background cases (Fig. 5). As with the mixture modeling with standing water, landscape changes that cause even small reflectance changes in areas with large fractions of standing water result in very large changes in NDVI.
In a second set of SAIL model simulations, the background was held constant as bare soil while the proportions of green and standing dead LAI in the canopies were varied to examine the effects of canopy characteristics on NDVI. Once again, the canopy is made up of mixtures of live and standing dead leaves with spherical leaf angle distributions. Each set of model run consists of calculations with total canopy LAI (green plus standing dead) of 0.01, 0.25, 0.50, 0.75, 1.00, 1.50, 2.00, 3.00, 4.00, and 5.00; with the fractions of green LAI being 100%, 75%, 50%, and 25% (Figs. 4 and 6).
Fig. 6.
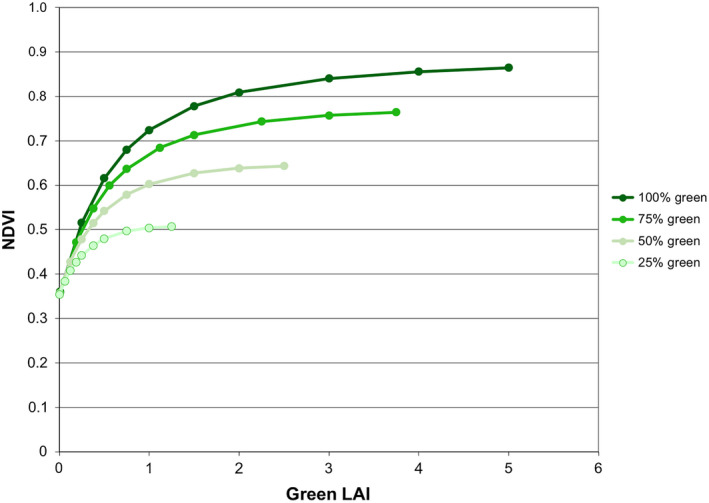
Effects of varying fractions of standing dead leaves mixed in graminoid canopies on NDVI from SAIL model simulations calculated from the reflectances shown in Fig. 4. The line colors correspond to the lines in Fig. 4. All simulations have bare soil as background.
Dead leaves have a low NDVI (0.253 compared to 0.352 for bare soil), so increasing the amount of standing dead leaves in the canopy acts to decrease NDVI. In red–near‐IR space reflectances with increasing LAI have nonlinear trajectories that rotate to become more aligned with lines of equal NDVI as the fraction of standing dead leaves increase. There can be significant changes in NDVI due to variations in fraction of standing dead leaves (Fig. 6). For example, with total LAI held constant at 1, NDVI varies from 0.724 to 0.442 as the fraction of green leaves drops from 100% to 25%. Holding the green LAI constant while increasing amounts of standing dead decreases NDVI, so for a constant green LAI of 0.75 NDVI will decrease from 0.680 to 0.497 as the fraction of standing dead increases from 0% to 75%.
These simulations suggest that tundra disturbances that affect the amount of standing dead leaves, such as tundra fires or intense herbivory that removes most of the standing vegetation may result in enhanced increases in NDVI during the recovery period due to the elimination of standing dead leaves from the canopy even in cases where green LAI is less than the green LAI of the original state.
Shrub tundra GeoSail model simulations
Shrub tundra was simulated using the GeoSail model, which is an enhancement of the SAIL model to account for shadows created by clumpy canopies (Huemmrich 2001). In these model scenarios, the shrubs are described as cylinders with a height to width ratio of 1 that are randomly scattered across the landscape. Shrubs are modeled as a mixture of alder leaves and twigs, with twigs representing 15% of the total LAI. Leaves are assigned spherical leaf angle distributions and twigs have planophile angular distributions. In the different simulations, shrub LAI are given values of 1.27, 2.55, and 4.25, representing low, medium, and high shrub LAI for non‐prostrate shrubs (Riedel et al. 2005b ). The background directly under the shrubs is moss while the area between the shrubs is covered by graminoid canopies or moss. In the simulations we consider three different backgrounds between shrubs: only moss, the SAIL simulation of a graminoid canopy over a moss background with 75% green LAI and 15% standing dead leaves and green LAI of either 0.56 or 1.50.
The addition of shrubs to the graminoid‐moss tundra results in an increase in NDVI. Even adding 10% shrub coverage increases NDVI by 0.04 (Fig. 7). Variation in the background tundra graminoid LAI results in variation of initial NDVI for the different scenarios with the cases of higher graminoid LAI having higher NDVI thus resulting in smaller changes in NDVI with the addition of shrub coverage (Fig. 7). Beyond 60% shrub coverage there is little to no change in NDVI with increasing shrub coverage and background effects are obscured. Further, LAI variation within shrub canopies has little effect on NDVI, even at high shrub coverage. For example, at 100% shrub cover the NDVI difference between shrubs with LAI of 2.55 and 4.25 is only 0.01 (Fig. 7).
Fig. 7.
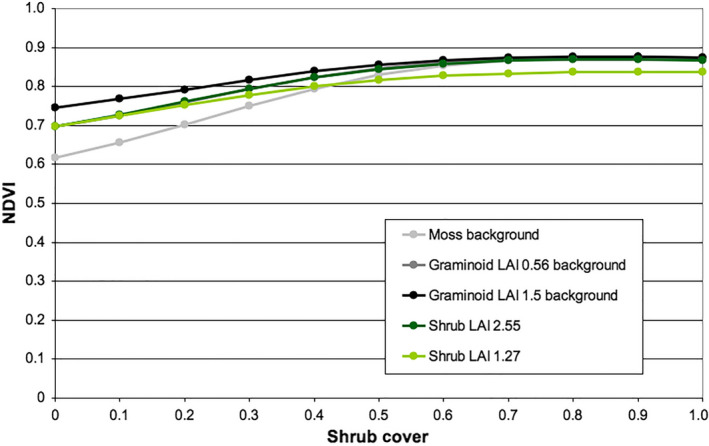
Simulations of shrub tundra NDVI using the GeoSail model. For simulations examining the effects of mixtures of shrubs and lower stature tundra (the black and gray lines), shrub leaf LAI is 4.25. For simulations varying shrub LAI (green lines) the graminoid canopy background has green LAI of 0.56 over a moss layer, while shrub LAI varies. The line colors correspond to the lines in Fig. 9.
Spruce woodland GeoSail model simulations
Landscapes at the tundra–taiga ecotone are simulated by adding spruce trees into the GeoSail model (Olthof and Pouliot 2010). Spruce trees are simulated as randomly scattered cones with a height to width ratio of 7. Spruce trees are modeled as a mixture of spruce needles and twigs, with twigs representing 15% of the total LAI. Needles are assigned spherical leaf angle distributions and twigs have planophile distributions (Huemmrich 2001). In the simulations, total spruce tree crown LAI was set to 3.40, 4.25, and 5.95 (Hall et al. 1997, Olthof and Pouliot 2010). Several different types of backgrounds were simulated: 100% shrub coverage with shrubs having LAIs of 0.43%, 0.85%, 2.55%, and 4.25%, and 100% moss or lichens.
For low spruce cover fractions NDVI is mainly determined by the characteristics of the background, whose sensitivity to increasing spruce tree cover depends on the background NDVI. The transition from shrub tundra to spruce woodland shows little change in NDVI, with NDVI actually decreasing with increasing spruce coverage for shrub tundra cases with LAIs >2.55, while changes in spruce cover are particularly observable for lichen woodlands with NDVI increasing 0.35 as spruce cover changes from 10% to 40% (Fig. 8). Once spruce cover is >50%, effects of backgrounds become negligible and changes in the spruce coverage or spruce crown LAI result in little to no change in NDVI.
Fig. 8.
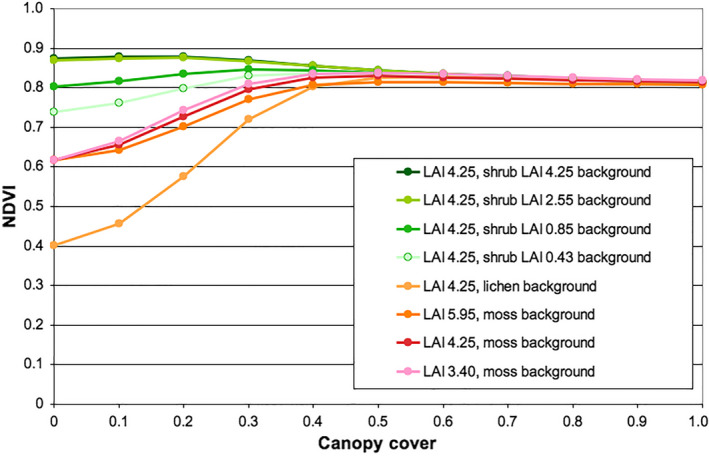
Simulations of spruce woodland NDVI using the GeoSail model. The x‐axis represents spruce tree fractional cover. Green lines have solid shrub layers as backgrounds, the red and orange lines have moss or lichen backgrounds. In the legend, the LAI numbers are the spruce tree crown LAI used in the simulations. The line colors correspond to the lines in Fig. 9.
The reflectance trajectories in red–near‐IR space for the linear mixture and turbid media SAIL model simulations were straight or slightly curved lines (Figs. 2 and 4), while the addition of shadowing for clumpy canopies in the GeoSail model produces trajectories with greater curvature (Huemmrich 2001) (Fig. 9). The shadow area per tree crown area at a specific solar zenith angle is larger for relatively tall thin trees, like black spruce, than for short statured shrubs. Shadow reflectance is generally dark in both red and near IR bands, so the addition of shadows into the landscape acts to pull the scene reflectance toward the origin that is close to lines of equal NDVI. This effect produces cases where changes in the coverage of canopies with shadows often results in little or no change in NDVI (Figs. 7 and 8).
Fig. 9.
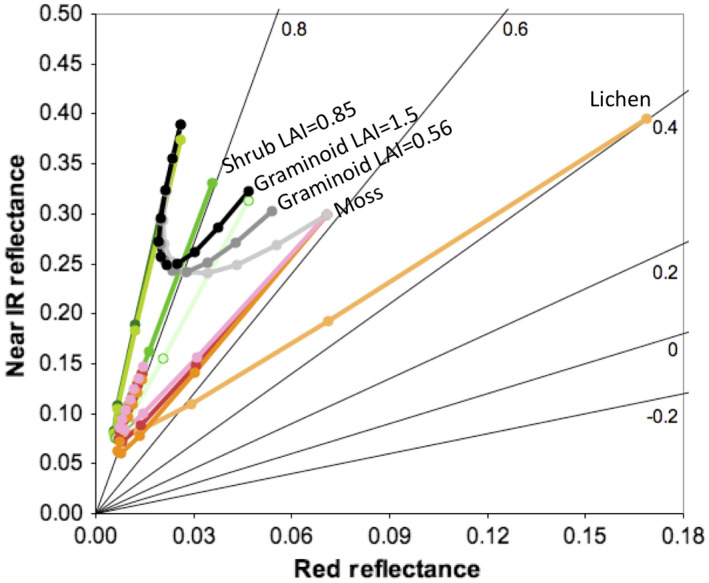
Red and near IR reflectances from GeoSail model simulations of shrub tundra and spruce woodlands. Labeled points are background reflectances. Black and gray lines are simulations of mixtures of shrubs and lower stature tundra. Green lines are simulations of spruce woodlands with solid shrub layer backgrounds. Orange and red shaded lines are simulations of spruce woodlands with lichen or moss backgrounds. Colors for lines and points in this figure are described in legends for Figs. 7 and 8. Lines of constant NDVI are black lines radiating from the origin with the NDVI values shown by each line.
Discussion
The implicit assumption of NDVI trend studies is that NDVI change is associated with ecological change, generally in the form of changes in green cover or LAI, and importantly no change in NDVI is assumed to mean no change in these variables. In this study, the significance of NDVI trends in high latitude ecosystems was examined through a series of simulated scenarios to illustrate how various landscape changes translate to changes in NDVI. One way to interpret these scenarios is to consider movement along the x‐axis in the figures showing changes in green plant coverage or LAI (Figs. 3, 5, 6, 7, and 8) as ecosystem change over time.
In most cases, NDVI changes associated with ecological change are most observable at low green plant coverage or low LAI values. In the polar desert linear mixture models increasing green vegetation coverage results in increases in NDVI although the response is less strong for changes at high values of green plant cover, either vascular plants or mosses. In the graminoid tundra SAIL turbid media simulations, NDVI is responsive to changes in green LAI up to LAI of ˜2.5, although moss backgrounds may once again cause an elevated NDVI and decrease the detectability of changes in canopy LAI. Further, decreasing the fraction of standing dead leaf area in the canopy can also cause an increase in NDVI with no change in green LAI. The shrub tundra GeoSail simulations show increasing shrub coverage results in increased NDVI up to ˜50% shrub cover. Spruce woodland GeoSail simulations show changes in spruce tree cover affects NDVI up to 30–40% spruce cover.
Further, as green plant cover or LAI begin to reach larger values the NDVI response to further change begins to saturate resulting in a variety of conditions where significant ecological change may occur with little to no change in NDVI. Cases where there is little change in NDVI associated with change in ecological variables include, for the polar desert mixture models, changes in green plant cover over 80% cover; for graminoid tundra models, changes in green LAI when LAI is >2.5; for shrub cover models, changes in shrub cover when shrub cover is >50%; and for spruce woodland models, changes in spruce cover when spruce cover is >40%. Further, significant changes in crown LAI for spruce or shrubs may result in little to no change in NDVI if there is no change in cover fraction. These simulations suggest that greening may not be observed in boreal forests even with increased spruce growth both in terms of increased tree cover or tree crown LAI. NDVI trends in these regions may represent a biased measure of ecological change where many types of changes, particularly ones expected to relate to greening, cannot be detected.
Other types of significant ecological change may display little to no change in NDVI. These types of transitions include bare ground to lichen cover, moss covered ground to graminoid canopies, and shrub tundra to spruce woodlands. These transitions may have important ramifications when trying to relate NDVI change with changes in ecosystem productivity or carrying capacity for animals, for example moss has fairly high NDVI but very much lower light use efficiency than vascular plants (Huemmrich et al. 2010a ) so a transition from moss cover to vascular plant cover may result in a significant increase in ecosystem productivity yet show little change in NDVI.
An important region where the NDVI signal may not be responding to ecosystem change is at the tundra‐taiga ecotone. One may expect that under climate change significant modifications would occur at the ecotone, yet, to date little change has been observed in NDVI in this region (Goetz et al. 2005). These simulations indicate the transition from shrub tundra to spruce woodland results in very little change in NDVI (Fig. 8), which may explain the lack of a NDVI greening signal in this critical region (Olthof and Pouliot 2010).
On the other hand, there are some landscape changes that may cause significant changes in NDVI but may be associated with small ecological changes. These types of changes include changes in snow cover when snow cover is <10% and increased spruce cover in open lichen woodlands where tree cover is <40%. NDVI is also sensitive to changes in standing water cover fraction, particularly when there is a large water cover fraction, either by drainage exposing bare ground or graminoid growth out of the standing water.
The observed multiyear NDVI trends from satellite time series in high latitude regions (both positive and negative trends) indicate significant changes are occurring in these ecosystems. However, the results of this study show that there are a number of conditions where NDVI has no or has minimal response to change in ecosystem composition or structure. The insensitivity of NDVI in these cases leads to the conclusion that evaluations of high latitude change based on NDVI alone may be significantly underestimating the overall magnitude of change in these ecosystems.
To evaluate the significance of multiyear NDVI changes, they must be placed in the context of descriptions of cover type and characteristics, such as background type, LAI and plant type coverage. These landscape descriptions define the capacity for NDVI change in response to ecosystem change, identifying regions where ecosystem change may be occurring undetected by NDVI or where there may be biases in the NDVI response, such as cases described in the boreal woodland simulations where increasing tree cover resulted in little change in NDVI while decreases in tree cover would be detected. This information would improve our interpretation of the multiyear NDVI trends.
In cases where ecosystem change does not produce a NDVI signal or produces an exaggerated response, direct analysis of reflectance changes may provide an improved method to evaluate change in high latitude landscapes (Figs. 2, 4, and 9). One approach was demonstrated for boreal forests with the physically based classifier from Hall et al. (1997), which used inversions of the GeoSail model to estimate both cover type and LAI together from red and near infrared reflectance values. Using a different model inversion approach, Zhang et al. (2020) examined multiyear tundra change in terms of plant, water, and snow cover and the fraction of photosynthetically active radiation absorbed by chlorophyll for an area around Utqiaġvik, Alaska using MODIS reflectance data from all seven of the land bands.
To directly use reflectance to track multiyear greening trends would require accurate and consistent determination of surface reflectance over time and across multiple satellite instruments. NDVI may continue to have a role through its ability to mitigate effects of varying illumination conditions due to atmospheric variability and changing solar and view angles.
Conclusions
Observations of temporal change in NDVI have been used as a key metric of high latitude ecosystem change. However, the simulations presented here suggest some care must be taken in the interpretation of the NDVI signal. In general, clear increases in NDVI values are associated with increases in green vegetation amount (green LAI or plant cover). However, NDVI responses to ecological change are not consistent. At higher values of LAI or plant cover the NDVI response to change decreases, sometimes displaying little or no response at all. Particularly noteworthy cases of poor NDVI response occur for increased crown LAI or cover in spruce forests that may bias the interpretation of greening/browning trends in boreal forests. Another example occurs at the tundra‐taiga ecotone where the simulations indicate transitions from shrub tundra to spruce woodland result in little change in NDVI. On the other hand, some types of landscape changes may produce outsized NDVI responses to small changes related to changes in water or snow coverage, two important variable non‐biological components of high latitude landscapes. These inconsistencies in NDVI responses exemplify the need for caution in its use as a metric of high latitude ecosystem change. Studies of multiyear NDVI trends should evaluate the landscape type to determine its capacity for positive or negative NDVI change to determine the significance of any observed trends.
Acknowledgments
Conceptualization, software, formal analysis, and writing (original draft preparation) was done by K. F. Huemmrich; conceptualization, writing (review and editing) was done by S. Vargas Zesati, P. Campbell, and C. Tweedie. All authors have read and agreed to the published version of the manuscript. This work is funded by NASA grant NNX17AC58A.
Huemmrich, K. F. , Vargas Zesati S., Campbell P., and Tweedie C.. 2021. Canopy reflectance models illustrate varying NDVI responses to change in high latitude ecosystems. Ecological Applications 31(8):e02435. 10.1002/eap.2435
Corresponding Editor: John S. Kimball.
Open Research
The code for the GeoSail model along with sample input and output data files (Huemmrich 2000) are available from ORNL DAAC https://doi.org/10.3334/ORNLDAAC/532. The code for the SAIL model is a subroutine of the GeoSail code.
Literature Cited
- Beamish, A. , et al. 2020. Recent trends and remaining challenges for optical remote sensing of Arctic tundra vegetation: a review and outlook. Remote Sensing of Environment 246:111872. [Google Scholar]
- Bhatt, U. S. , et al. 2017. Changing seasonality of panarctic tundra vegetation in relationship to climatic variables. Environmental Research Letters 12:055003. [Google Scholar]
- Bhatt, U. , Walker D., Raynolds M., Bieniek P., Epstein H., Comiso J., Pinzon J., Tucker C., and Polyakov I.. 2013. Recent declines in warming and vegetation greening trends over Pan‐Arctic tundra. Remote Sensing 5:4229–4259. [Google Scholar]
- Epstein, H. , et al. 2019. Tundra greenness [in Arctic Report Card 2018]. https://www.arctic.noaa.gov/Report‐Card
- Epstein, H. E. , Raynolds M. K., Walker D. A., Bhatt U. S., Tucker C. J., and Pinzon J. E.. 2012. Dynamics of aboveground phytomass of the circumpolar Arctic tundra during the past three decades. Environmental Research Letters 7:015506. [Google Scholar]
- Gamon, J. A. , Huemmrich K. F., Stone R. S., and Tweedie C. E.. 2013. Spatial and temporal variation in primary productivity (NDVI) of coastal Alaskan tundra: Decreased vegetation growth following earlier snowmelt. Remote Sensing of Environment 129:144–153. [Google Scholar]
- Garcia‐Haro, F. J. , Gilabert M. A., and Melia J.. 1996. Linear spectral mixture modelling to estimate vegetation amount from optical spectral data. International Journal of Remote Sensing 17:3373–3400. [Google Scholar]
- Goetz, S. J. , Bunn A. G., Fiske G. J., and Houghton R. A. 2005. Satellite‐observed photosynthetic trends across boreal North America associated with climate and fire disturbance. Proceedings of the National Academy of Sciences USA 102:13521–13525. [DOI] [PMC free article] [PubMed] [Google Scholar]
- Guay, K. C. , Beck P. S. A., Berner L. T., Goetz S. J., Baccini A., and Buermann W. 2014. Vegetation productivity patterns at high northern latitudes: a multi‐sensor satellite data assessment. Global Change Biology 20:3147–3158. [DOI] [PMC free article] [PubMed] [Google Scholar]
- Hall, F. G. , Knapp D. E., and Huemmrich K. F. 1997. Physically based classification and satellite mapping of biophysical characteristics in the southern boreal forest. Journal of Geophysical Research: Atmospheres 102(D24):29567–29580. [Google Scholar]
- Hope, A. S. , and Stow D. A.. 1996. Shortwave reflectance properties of Arctic Tundra landscapes. Pages 155–164 in Reynolds J. F., editor. Landscape function and disturbance in Arctic Tundra ecological studies (analysis and synthesis). Volume 120. Springer, Berlin, Germany. [Google Scholar]
- Huang, M. , et al. 2017. Velocity of change in vegetation productivity over northern high latitudes. Nature Ecology and Evolution 1:1649. [DOI] [PubMed] [Google Scholar]
- Huemmrich, K. F. 2000. BOREAS TE‐18 Geosail Canopy Reflectance Model. ORNL DAAC, Oak Ridge, Tennessee, USA. [Google Scholar]
- Huemmrich, K. F. 2001. The GeoSail model: a simple addition to the SAIL model to describe discontinuous canopy reflectance. Remote Sensing of Environment 75(3):423–431. [Google Scholar]
- Huemmrich, K. F. , Gamon J. A., Tweedie C. E., Oberbauer S. F., Kinoshita G., Houston S., Kuchy A., Hollister R. D., Kwon H., and Mano M.. 2010a. Remote sensing of tundra gross ecosystem productivity and light use efficiency under varying temperature and moisture conditions. Remote Sensing of Environment 114:481–489. [Google Scholar]
- Huemmrich, K. F. , Gamon J. A., Tweedie C. E., Campbell P. K. E., Landis D. R., and Middleton E. M.. 2013. Arctic tundra vegetation functional types based on photosynthetic physiology and optical properties. IEEE Journal of Selected Topics in Applied Earth Observations and Remote Sensing. 6:265–275. [Google Scholar]
- Huemmrich, K. F. , et al. 2010b. Tundra carbon balance under varying temperature and moisture regimes. Journal of Geophysical Research: Biogeosciences 115. [Google Scholar]
- Jenkins, L. K. , Barry T., Bosse K. R., Currie W. S., Christensen T., Longan S., Shuchman R. A., Tanzer D., and Taylor J. J.. 2020. Satellite‐based decadal change assessments of pan‐Arctic environments. Ambio 49:820–832. [DOI] [PMC free article] [PubMed] [Google Scholar]
- Jia, G. J. , Epstein H. E., and Walker D. A.. 2009. Vegetation greening in the Canadian Arctic related to decadal warming. Journal of Environmental Monitoring 11:2231. [DOI] [PubMed] [Google Scholar]
- Ju, J. , and Masek J. G.. 2016. The vegetation greenness trend in Canada and US Alaska from 1984–2012 Landsat data. Remote Sensing of Environment 176:1–16. [Google Scholar]
- Kobayashi, H. , Nagai S., Kim Y., Yang W., Ikeda K., Ikawa H., Nagano H., and Suzuki R.. 2018. In situ observations reveal how spectral reflectance responds to growing season phenology of an open evergreen Forest in Alaska. Remote Sensing 10:1071. [Google Scholar]
- Kuusinen, N. , Juola J., Karki B., Stenroos S., and Rautiainen M.. 2020. A spectral analysis of common boreal ground lichen species. Remote Sensing of Environment 247:111955. [DOI] [PMC free article] [PubMed] [Google Scholar]
- Laidler, G. J. , and Treitz P.. 2003. Biophysical remote sensing of arctic environments. Progress in Physical Geography: Earth and Environment 27:44–68. [Google Scholar]
- May, J. L. , Parker T., Unger S., and Oberbauer S. F.. 2018. Short term changes in moisture content drive strong changes in Normalized Difference Vegetation Index and gross primary productivity in four Arctic moss communities. Remote Sensing of Environment 212:114–120. [Google Scholar]
- Myers‐Smith, I. H. , et al. 2020. Complexity revealed in the greening of the Arctic. Nature Climate Change 10(2):106–117. [Google Scholar]
- Myneni, R. B. , Keeling C. D., Tucker C. J., Asrar G., and Nemani R. R.. 1997. Increased plant growth in the northern high latitudes from 1981 to 1991. Nature 386:698. [Google Scholar]
- National Academies of Sciences, Engineering, and Medicine 2019. Understanding northern latitude vegetation greening and browning: proceedings of a workshop. National Academies Press, Washington, D.C., USA. [Google Scholar]
- Olthof, I. , and Pouliot D.. 2010. Treeline vegetation composition and change in Canada's western Subarctic from AVHRR and canopy reflectance modeling. Remote Sensing of Environment 114:805–815. [Google Scholar]
- Pattison, R. R. , Jorgenson J. C., Raynolds M. K., and Welker J. M. 2015. Trends in NDVI and tundra community composition in the Arctic of NE Alaska between 1984 and 2009. Ecosystems 18:707–719. [Google Scholar]
- Raynolds, M. K. , Walker D. A., Epstein H. E., Pinzon J. E., and Tucker C. J.. 2012. A new estimate of tundra‐biome phytomass from trans‐Arctic field data and AVHRR NDVI. Remote Sensing Letters 3(5):403–411. [Google Scholar]
- Riedel, S. M. , et al. 2005a. Spatial and temporal heterogeneity of vegetation properties among four tundra plant communities at Ivotuk, Alaska, USA. Arctic, Antarctic, and Alpine Research 37:25–33. [Google Scholar]
- Riedel, S. M. , Epstein H. E., and Walker D. A.. 2005b. Biotic controls over spectral reflectance of arctic tundra vegetation. International Journal of Remote Sensing 26:2391–2405. [Google Scholar]
- Rocha, A. V. , Loranty M. M., Higuera P. E., Mack M. C., Hu F. S., Jones B. M., Breen A. L., Rastetter E. B., Goetz S. J., and Shaver G. R.. 2012. The footprint of Alaskan tundra fires during the past half‐century: implications for surface properties and radiative forcing. Environmental Research Letters 7:044039. [Google Scholar]
- Rouse, J. W. , Haas R. H., Schell J. A., and Deering D. W.. 1973. Monitoring vegetation systems in the Great Plains with ERTS. Pages 309–317 in Proceedings of the Third Earth Resources Technology Satellite‐1 Symposium, Goddard Space Flight Center, NASA SP‐351. Science and Technical Information Office, NASA, Washington, D.C., USA. [Google Scholar]
- Spadavecchia, L. , Williams M., Bell R., Stoy P. C., Huntley B., and van Wijk M. T.. 2008. Topographic controls on the leaf area index and plant functional type of a tundra ecosystem. Journal of Ecology 96(6):1238–1251. [Google Scholar]
- Steltzer, H. , and Welker J. M.. 2006. Modeling the effect of photosynthetic vegetation properties on the NDVI–LAI relationship. Ecology 87:2765–2772. [DOI] [PubMed] [Google Scholar]
- Tucker, C. J. 1979. Red and photographic infrared linear combinations for monitoring vegetation. Remote Sensing of Environment 8:127–150. [Google Scholar]
- Verhoef, W. 1984. Light scattering by leaf layers with application to canopy reflectance modeling: the SAIL model. Remote Sensing of Environment 16(2):125–141. [Google Scholar]
- Vogelmann, J. E. , and Moss D. M.. 1993. Spectral reflectance measurements in the genus Sphagnum. Remote Sensing of Environment. 45(3):273–279. [Google Scholar]
- Walker, D. , et al. 2003. Phytomass, LAI, and NDVI in northern Alaska: relationships to summer warmth, soil pH, plant functional types, and extrapolation to the circumpolar Arctic. Journal of Geophysical Research 108:8169. [Google Scholar]
- Walker, D. A. , et al. 2012. Environment, vegetation and greenness (NDVI) along the North America and Eurasia Arctic transects. Environmental Research Letters 7:015504. [Google Scholar]
- Walther, S. , Guanter L., Heim B., Jung M., Duveiller G., Wolanin A., and Sachs T.. 2018. Assessing the dynamics of vegetation productivity in circumpolar regions with different satellite indicators of greenness and photosynthesis. Biogeosciences 15:6221–6256. [Google Scholar]
- Wang, J. A. , and Friedl M. A.. 2019. The role of land cover change in Arctic‐Boreal greening and browning trends. Environmental Research Letters 14:125007. [Google Scholar]
- Zhang, Q. , Yao T., Huemmrich K. F., Middleton E. M., Lyapustin A., and Wang Y.. 2020. Evaluating impacts of snow, surface water, soil and vegetation on empirical vegetation and snow indices for the Utqiaġvik tundra ecosystem in Alaska with the LVS3 model. Remote Sensing of Environment 240:111677. [Google Scholar]
- Zhang, Y. , Song C., Band L. E., Sun G., and Li J.. 2017. Reanalysis of global terrestrial vegetation trends from MODIS products: browning or greening? Remote Sensing of Environment 191:145–155. [Google Scholar]
Associated Data
This section collects any data citations, data availability statements, or supplementary materials included in this article.
Data Availability Statement
The code for the GeoSail model along with sample input and output data files (Huemmrich 2000) are available from ORNL DAAC https://doi.org/10.3334/ORNLDAAC/532. The code for the SAIL model is a subroutine of the GeoSail code.


