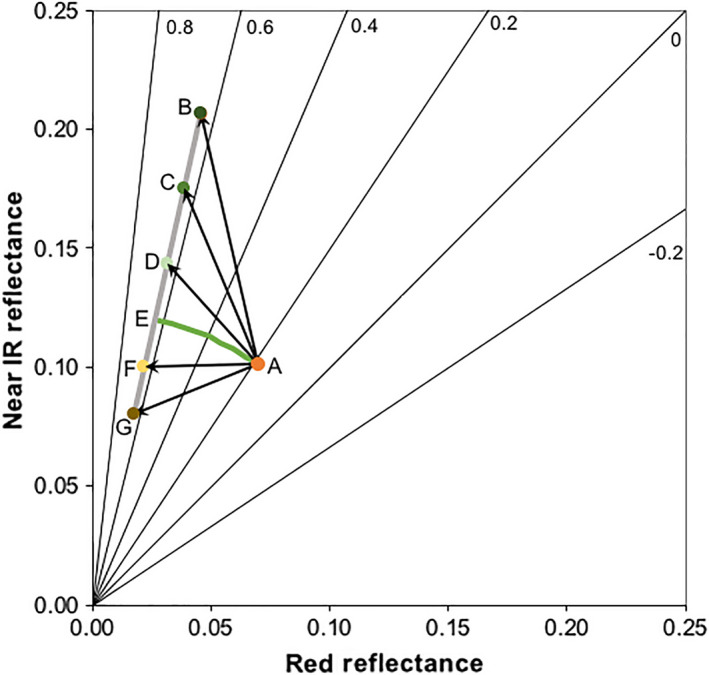
Fig. 1.

Red and near IR reflectance space, where lines of constant normalized difference vegetation index (NDVI) are straight black lines radiating from the origin with the NDVI values shown by each line. The black arrows show transitions from an initial reflectance, at point A, to the reflectances under different conditions indicated by points B, C, D, F, or G. The reflectance changes can be partitioned into two components, the change that results in a change in NDVI shown by the green arc AE and the reflectance change that has no effect on NDVI shown as the gray line that radiates from the origin. Even though the reflectance change from A to any of the other points B, C, D, F, or G are different in both magnitude and direction, they all result in the same change in NDVI.
