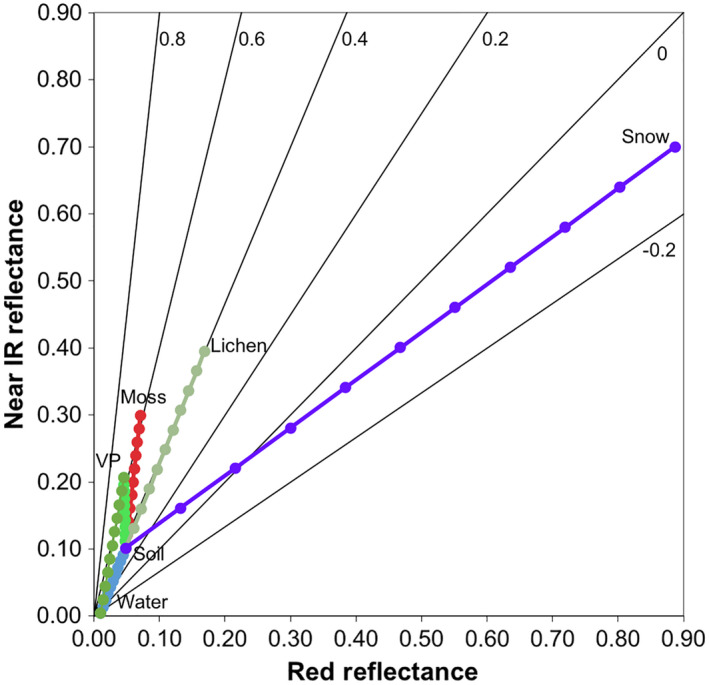
Fig. 2.

Red and near IR reflectances of tundra landscape components with colored lines showing reflectances calculated from the linear mixture model of mixtures of bare soil and the other components where the combination of the two components totals 100%. The component end members are listed in Table 1 and labeled in the plot. VP stands for vascular plants (canopy consisting of graminoids with a green leaf area index [LAI] of 0.75 and standing dead LAI of 0.25). The line colors correspond to the lines in Fig. 3 (see Fig. 3 legend), and points along these lines represent 10% increments of the mixtures. Lines of constant NDVI are black lines radiating from the origin with the NDVI values shown by each line.
