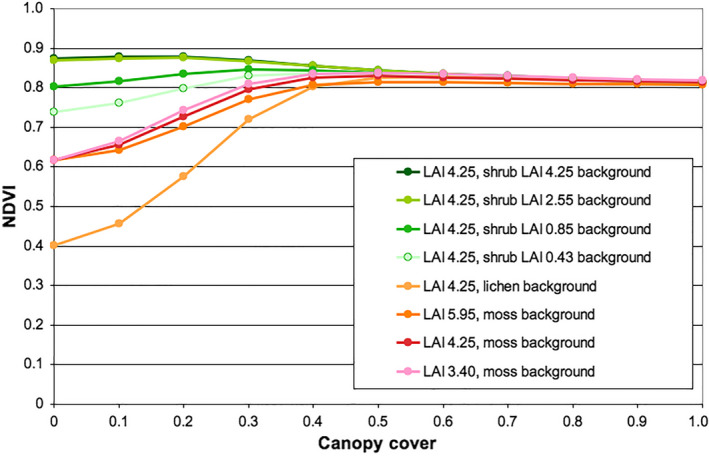
Fig. 8.

Simulations of spruce woodland NDVI using the GeoSail model. The x‐axis represents spruce tree fractional cover. Green lines have solid shrub layers as backgrounds, the red and orange lines have moss or lichen backgrounds. In the legend, the LAI numbers are the spruce tree crown LAI used in the simulations. The line colors correspond to the lines in Fig. 9.
