
Figure 3.
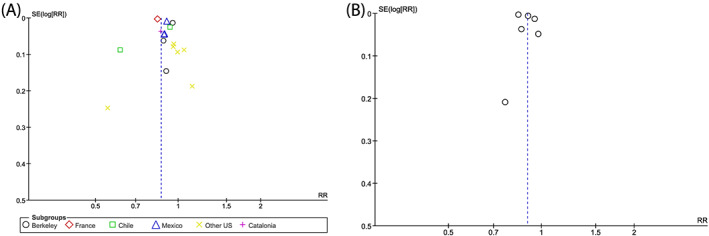
Funnel plot for examining publication bias in included studies on sugar‐sweetened beverage taxes for step one (left) and step two (right) of the meta‐analysis. Note. All results were scaled to the expected effect of a 10% tax. SE is standard error on log scale. RR is the relative change in taxed sugar‐sweetened beverage consumption for posttax compared with pretax period or taxed jurisdiction compared to control jurisdiction. Each study result is indicated here coloured by jurisdiction [Colour figure can be viewed at wileyonlinelibrary.com]