Figure 1.

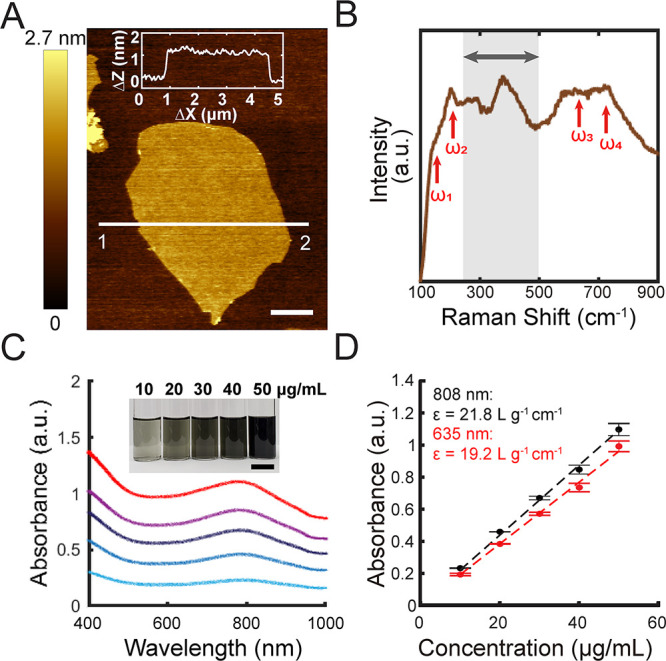
Structural and optical characterization of Ti3C2Tx. (A) Representative atomic force microscopy (AFM) image of a single-layer Ti3C2Tx flake dispersed on a Si/300 nm SiO2 substrate with an average thickness of 1.16 ± 0.11 nm. Inset: Thickness profile from point 1 to point 2. Scale bar is 1 μm. (B) Representative Raman spectrum of dispersed Ti3C2Tx flakes. Red arrows indicate the internal vibration modes of Ti3C2Tx, and the gray region indicates vibration modes of surface terminations, Tx. (C) Average vis–NIR absorption spectra of Ti3C2Tx suspensions of different concentrations (bottom to top: 10, 20, 30, 40, and 50 μg/mL) (n = 3). Inset: Optical image of Ti3C2Tx suspensions of different concentrations. Scale bar is 2 cm. (D) Absorbance as a function of Ti3C2Tx suspension concentration at 635 nm (red) and 808 nm (black), respectively. Data are presented as mean ± SD (n = 3).
