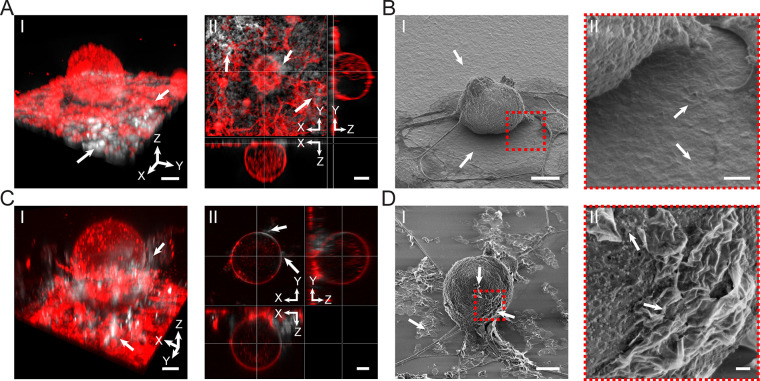
Figure 3.
Ti3C2Tx interfaces with DRG neurons. (A) Interface between Ti3C2Tx films and DRG neurons. (I) Representative 3D reconstructed confocal laser scanning fluorescence image of DRG neurons labeled with plasma membrane stain (red color, CellMask plasma membrane dye) seeded on a 25 μg/cm2 Ti3C2Tx film (white color). The white arrows denote Ti3C2Tx flakes. Scale bar is 10 μm. (II) Orthogonal sections of the cell in I. Scale bar is 10 μm. (B) Representative SEM image of DRG neurons seeded on a Ti3C2Tx film. Scale bar is 10 μm. (II) Expanded view of the marked red dashed box in I. Scale bar is 1 μm. (C) Interface between dispersed Ti3C2Tx flakes and DRG neurons. (I) Representative 3D reconstructed confocal laser scanning fluorescence image of DRG neurons labeled with plasma membrane stain (red color, CellMask plasma membrane dye) incubated for 24 h with a dispersion of 100 μg/mL Ti3C2Tx flakes (white color). The white arrows denote Ti3C2Tx flakes attached to the neuron. Scale bar is 10 μm. (II) Orthogonal sections of the cell in I. Scale bar is 10 μm. (D) Representative SEM image of a DRG neuron incubated with 100 μg/mL Ti3C2Tx flakes. White arrows denote Ti3C2Tx flakes interfaced with the neuron and dispersed on the substrate. Scale bar is 10 μm. (II) Expanded view of the marked red dashed box in I. Scale bar is 1 μm.

