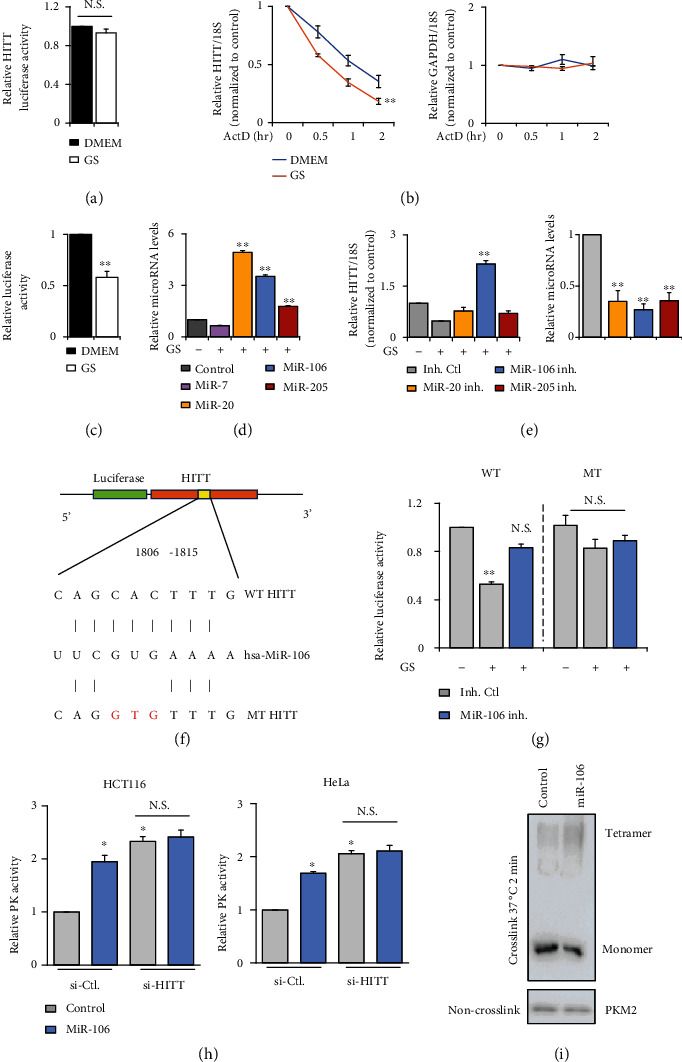
Figure 6.

HITT was reduced upon glucose starvation through miR-106. (a) HITT promoter-driven luciferase activity was detected by the luciferase reporter assay under GS in HeLa cells. (b) The half-lives of HITT and GAPDH mRNA were measured by qRT-PCR in the presence of ActD in HeLa cells with or without GS. (c) The luciferase activities of the pMIR-HITT reporter were detected in HeLa cells with or without GS. (d) Expression levels of microRNA normalized to U6 were measured by qRT-PCR under GS in HeLa cells. (e) Relative expression levels of HITT were determined by qRT-PCR after transfection with microRNA inhibitors (inh.) in HeLa cells. MicroRNA levels normalized to U6 were measured by qRT-PCR. (f) Schematic description of the hypothetical duplexes formed by interactions between the binding site in HITT (top), miR-106 (middle), and the mutated HITT (bottom). (g) The luciferase activities of wild-type (WT) or miR-106 binding defective mutant (MT) HITT luciferase reporter were detected in HeLa cells after transfection with the miR-106 inhibitor with or without GS, as indicated in the figures. (h) PK activities of HCT116 and HeLa were detected after transfection of miR-106 with or without HITT KD. (i) The expression levels of PKM2 monomers and oligomers were determined after miR-106 transfection. Data are derived from three independent experiments and presented as mean ± SEM in the bar graphs. Values of controls were normalized to 1. ∗P < 0.05, ∗∗P < 0.01 (c–e, g, h). N.S.: not significant (a–e, g, h); Ctl.: control.
