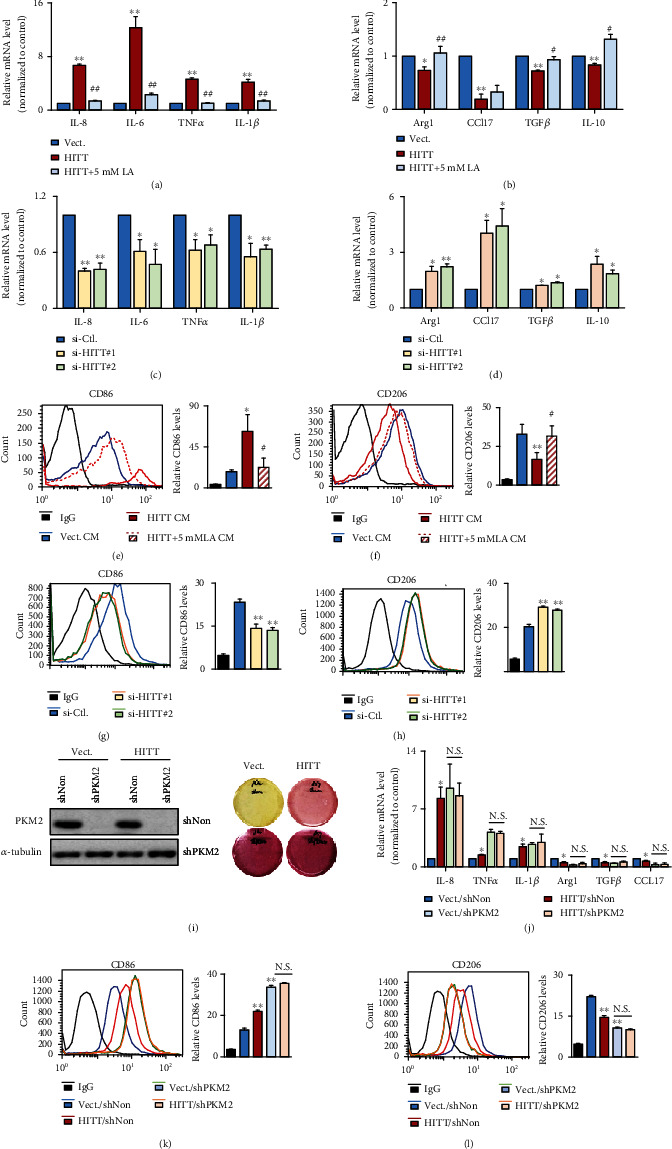
Figure 7.

HITT-regulated PKM2-lactate repression alleviates M1–M2 macrophage polarization. (a–d) The mRNA expression levels of IL-8, IL-6, TNFα, IL-1β, and INOS (a, c) or Arg1, CCL17, TGFβ, and IL-10 (b, d) were analyzed by real-time RT-PCR in THP-1 cells cultured with conditioned medium (CM) from HeLa cells after the indicated treatments. (e–h) The CD86 (e, g) or CD206 (f, h) expression levels of THP-1 cells cultured with CM from HeLa cells after the indicated treatments were determined by flow cytometry. (i) PKM2 KD efficiencies of the indicated stable cells were determined by WB (left). Right photos show the representative media colors of these stable cells. (j) The mRNA expression levels of IL-8, TNFα, IL-1β, Arg1, TGFβ, and CCL17 were analyzed by real-time RT-PCR in THP-1 cells cultured with conditioned medium (CM) from HeLa cells after the indicated treatments. (k, l) The CD86 (k) or CD206 (l) expression levels of THP-1 with conditioned medium (CM) from HeLa cells after the indicated treatments were determined by flow cytometry. Data are derived from three independent experiments and presented as mean ± SEM in the bar graphs. ∗P < 0.05, ∗∗P < 0.01. N.S.: not significant (a–h, j–l). #P < 0.05, ##P < 0.01, compared with HITT CM-treated group (a, b, e, f). Vect.: vector; Ctl.: control; LA: lactic acid.
