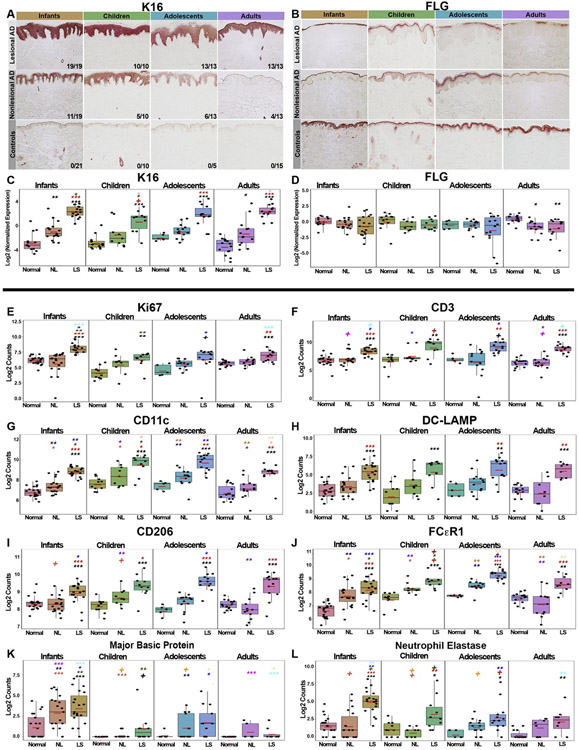
Fig 6.
IHC studies assessing AD across pediatric and adult age groups. A and B, Representative IHC images of keratin 16 (K16) and FLG staining at 10× magnification in AD age groups and age-appropriate controls. C and D, Corresponding mRNA expression levels by qRT-PCR. Values show log2 expression presented as means ± SEMs. Red bars represent means. E-L, Boxplots depicting cell counts of skin infiltrates in nonlesional/lesional AD and healthy skin across age groups. Values are presented as means ± SEMs. Black symbols: significance of comparison to normal; red symbols: significance of comparison between lesional and nonlesional skin; symbols in other colors: significance of comparison between respective groups. DC-LAMP, Dendritic cell - lysosomal associated membrane protein; LS, lesional; NL, nonlesional. ***P < .001, **P < .01, *P < .05, +P < .1.

