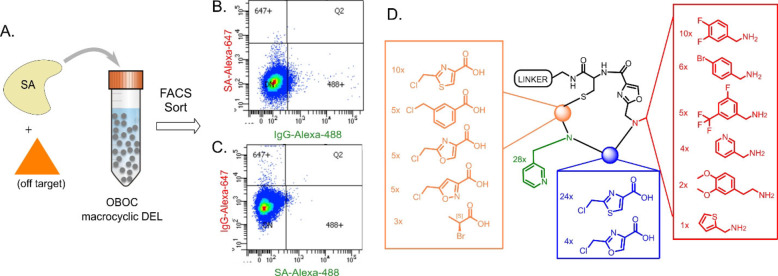
Figure 3.
Summary of screening experiments. A) Library beads were incubated with fluorescently‐labeled streptavidin (SA) and an orthogonally labelled off‐target, then sorted by FACS. B), C) FACS plots showing data from the SA‐A647/IgG‐A488 (B) and IgG‐A647/SA‐A488 (C) replicate screens. Beads that shifted into the 647+ or 488+ gates were collected, and the encoding DNAs deep sequenced for structure determination. D) “Bottom‐up” analysis of 28 “2.5‐mer” SA hits, indicating the frequency of each chemical unit at each position. This illustrates a conserved pyridine side‐chain (green) that is almost exclusively adjacent to a thiazole backbone unit (blue).

