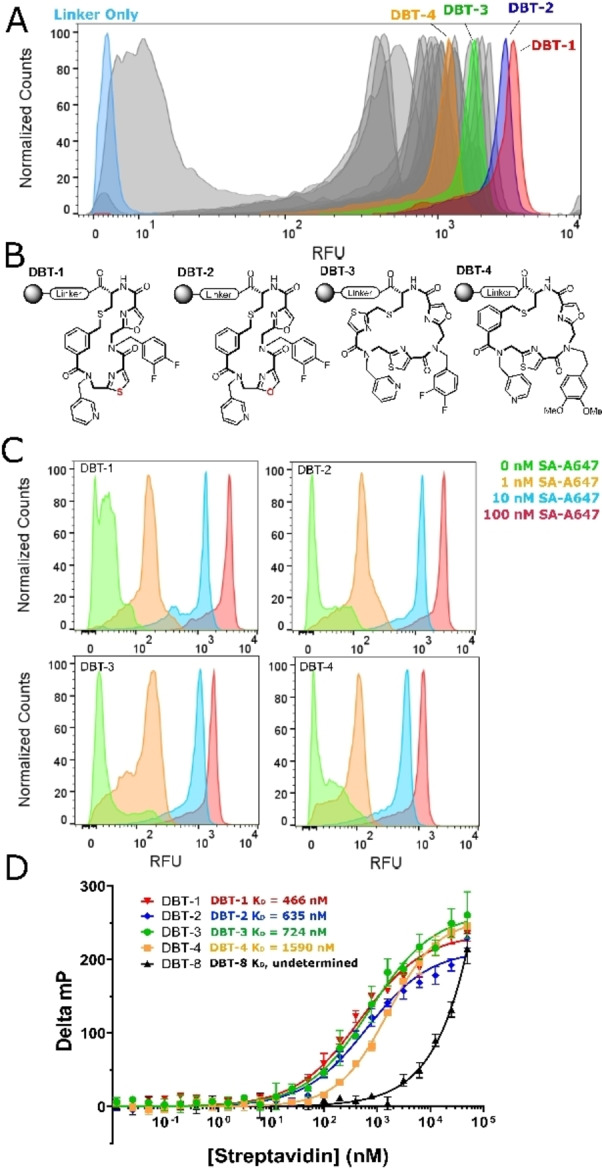
Figure 4.

Validation of screening hits. A) FACS histogram showing the relative fluorescence of beads displaying resynthesized hits after incubation with 100 nM SA‐A647. Highlighted samples were analyzed further. B) Structures of the selected hits. C) Titration of beads displaying DBT compounds with the indicated concentration of SA‐A647, followed by FACS analysis. FACS histograms are shown. D) Fluorescence polarization data for the selected DBT compounds.
