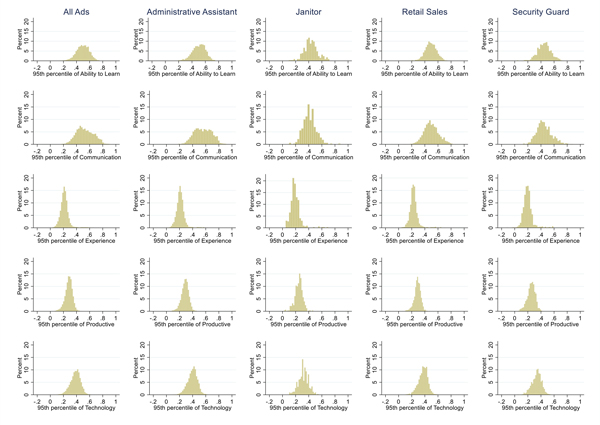
Appendix Figure A4: Distributions of 95th Percentiles of CS Scores for Stereotypes Related to Skills.
Note: Data come from the job ads collected in NBB. Each panel plots the distribution of CS score at the 95th percentile for the job ads with each stereotype related to skills. The first column contains the distribution of all the ads in our sample. The remaining columns disaggregate the job ads by occupation.

