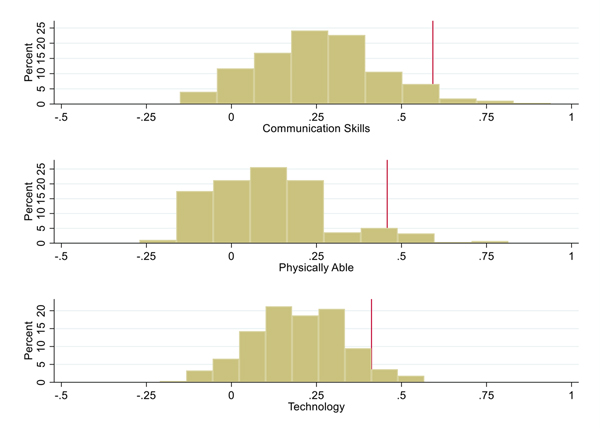
Figure 3: Distributions of CS Scores within Example Ad (from Figure 2).
Note: Based on the text from the job ad in Figure 2, these histograms plot the distributions of CS scores for all trigrams in the example job ad, for three stereotypes. The solid line in each graph indicates the 95th percentile.

