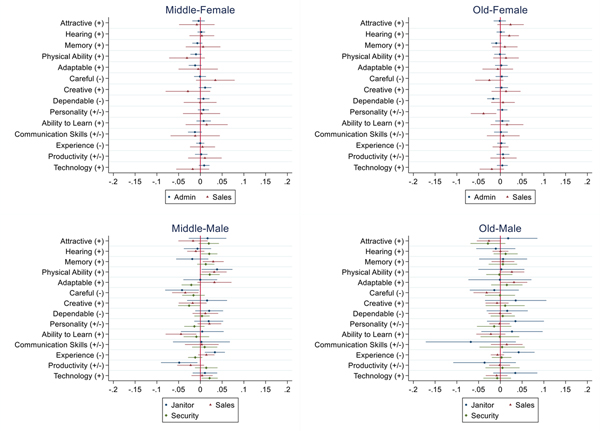
Figure 6: Baseline Results by Gender, Age, and Occupation.
Note: Figure reports estimated marginal effects from equation (10) and 95% confidence intervals. Predicted signs of each coefficient according to the industrial psychology literature are presented in parentheses. Positive predictions indicate we expect to see more discrimination against older applicants, negative predictions indicate we expect to see less discrimination against older applicants. Standard errors are clustered at the job-ad level.

