
FIGURE 2.
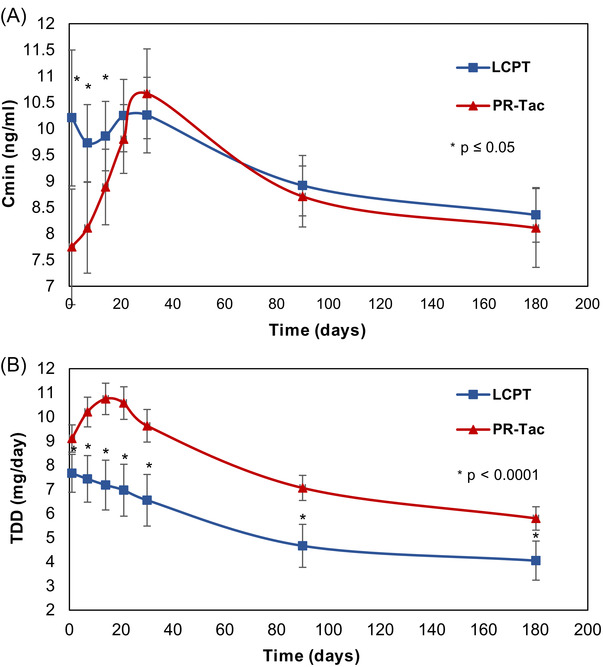
Trough levels and total daily doses over the study period in the LCPT and PR‐Tac groups. Graphs show mean ± SD levels for: A, Trough levels (Cmin), B, TDD (total daily dose). * P‐value < .05
Official websites use .gov
A
.gov website belongs to an official
government organization in the United States.
Secure .gov websites use HTTPS
A lock (
) or https:// means you've safely
connected to the .gov website. Share sensitive
information only on official, secure websites.
Trough levels and total daily doses over the study period in the LCPT and PR‐Tac groups. Graphs show mean ± SD levels for: A, Trough levels (Cmin), B, TDD (total daily dose). * P‐value < .05