FIGURE 3.

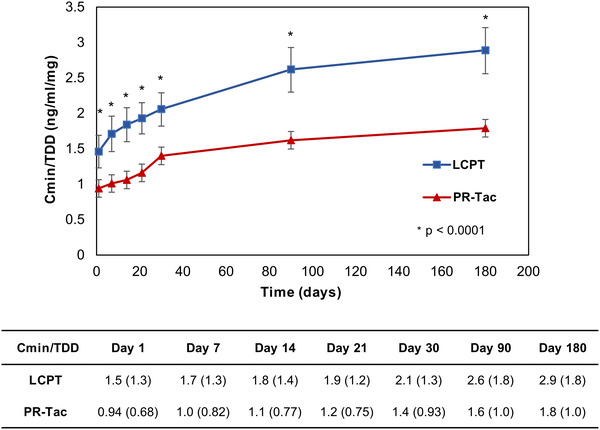
Relative bioavailability of tacrolimus over the study period in the LCPT and PR‐Tac groups. The graph shows mean ± SD for normalized blood tacrolimus levels (Cmin/TDD) over 6 months of follow‐up. * P‐value < .0001

Relative bioavailability of tacrolimus over the study period in the LCPT and PR‐Tac groups. The graph shows mean ± SD for normalized blood tacrolimus levels (Cmin/TDD) over 6 months of follow‐up. * P‐value < .0001