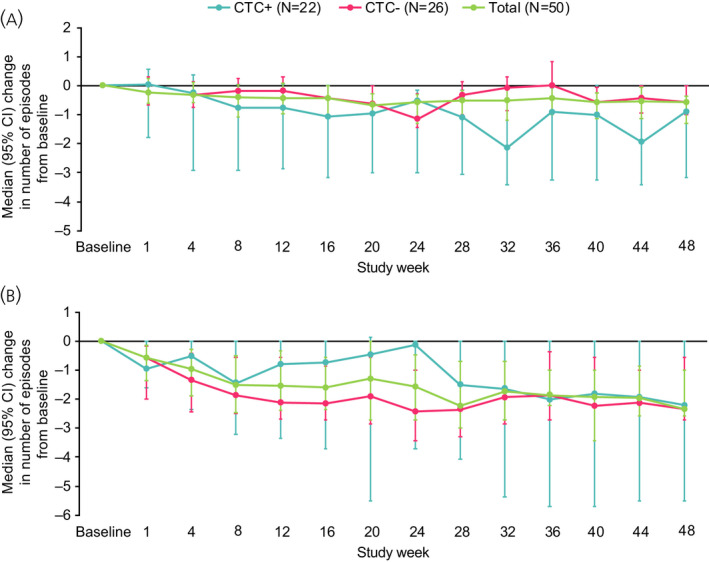
FIGURE 3.

Change in number of (A) diarrhoea and (B) flushing episodes in LAN‐treated patients according to CTC status. Median data over 7 days preceding the time point are presented for all time points up to Week 12; median data from days 11–17 post‐injection are used for subsequent time points. Results based on patients with data available for symptom episodes and CTC status. Two patients had missing CTC status at baseline. Error bars depict 95% CI. CI, confidence interval; CTC, circulating tumour cell; LAN, lanreotide autogel
