FIGURE 6.

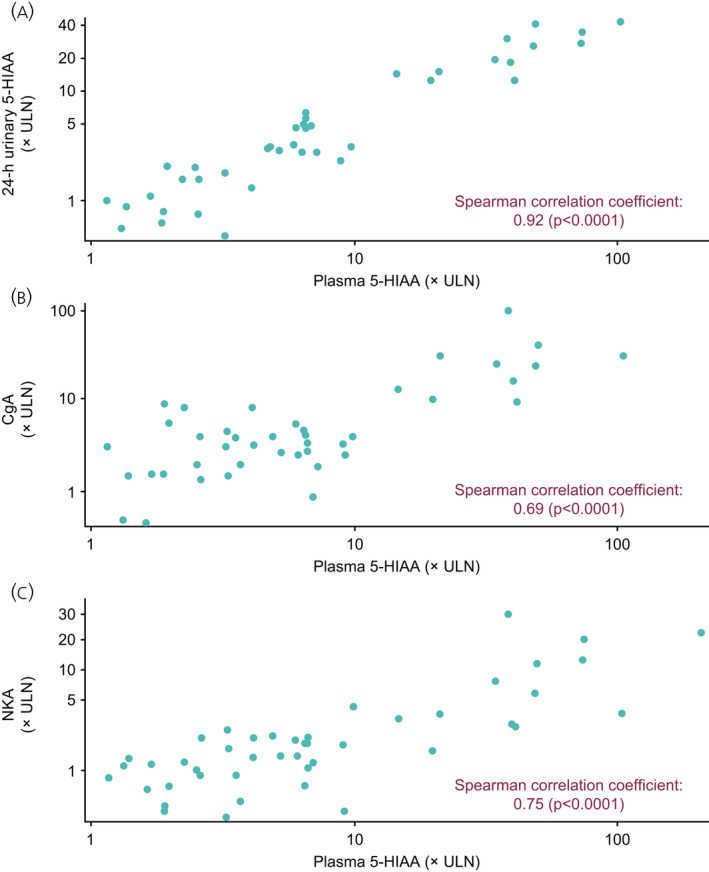
Correlation between baseline levels of plasma 5‐HIAA and (A) 24‐h urinary 5‐HIAA, (B) CgA and (C) NKA. 5‐HIAA, 5‐hydroxyindoleacetic acid; CgA, chromogranin A; NKA, neurokinin A; ULN, upper limit of normal

Correlation between baseline levels of plasma 5‐HIAA and (A) 24‐h urinary 5‐HIAA, (B) CgA and (C) NKA. 5‐HIAA, 5‐hydroxyindoleacetic acid; CgA, chromogranin A; NKA, neurokinin A; ULN, upper limit of normal