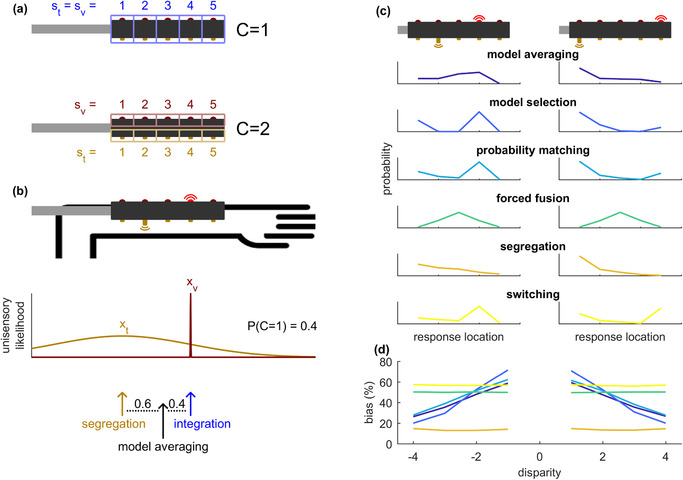
FIGURE 1.

Causal inference (a‐b) and model predictions (c‐d). (a) Two causal models: common cause (C = 1) and separate causes (C = 2). Causal inference makes use of the generative model that stimuli are generated according to C = 1 with a probability of pcommon (the prior on common cause), and according to C = 2 with a probability of 1 − pcommon . (c) On each trial, an observer has to infer what the likelihood is of each model, given the sensory input and the prior on common cause. This likelihood is termed the posterior on common cause, denoted by P(C = 1). For model averaging, the final cue estimate is based on a weighing of the fully segregated and fully integrated sensory input, with a relative weight of P(C = 1) for the segregated signal. (c) Predictions of various models of the response distributions on two example bimodal stimuli. The upper three models involve causal inference, whereas the bottom three do not. (d) Model predictions for the relation between spatial disparity (the distance between visual and tactile stimulus) and bias (the average shift of the tactile response towards the visual cue, as a percentage of this disparity). Causal inference models predict a negative relation between bias and absolute disparity, while for the alternative models, the percent bias is constant. Parameter values used in (c‐d): pcommon = .7, σ t = 1.5, μ p = 3, σ p = 100, wt = .5, pt = .5
