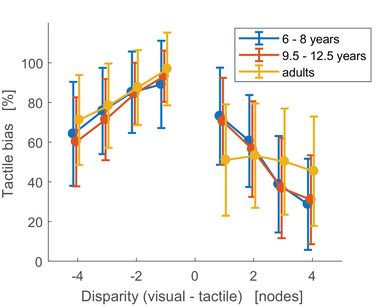
FIGURE 4.

Response bias as a function of cue disparity. Disparity is presented in units of inter‐node distance, which correspond to 2.5 cm. A bias of zero indicates perfect localization, whereas a bias of 100% indicates that the tactile stimulus is localized at the visual stimulus location. A negative relation between bias and absolute disparity is indicative of a causal inference strategy
